29
/
en
AIzaSyAYiBZKx7MnpbEhh9jyipgxe19OcubqV5w
April 1, 2024
79157
Barbados
BRB
true
2
1
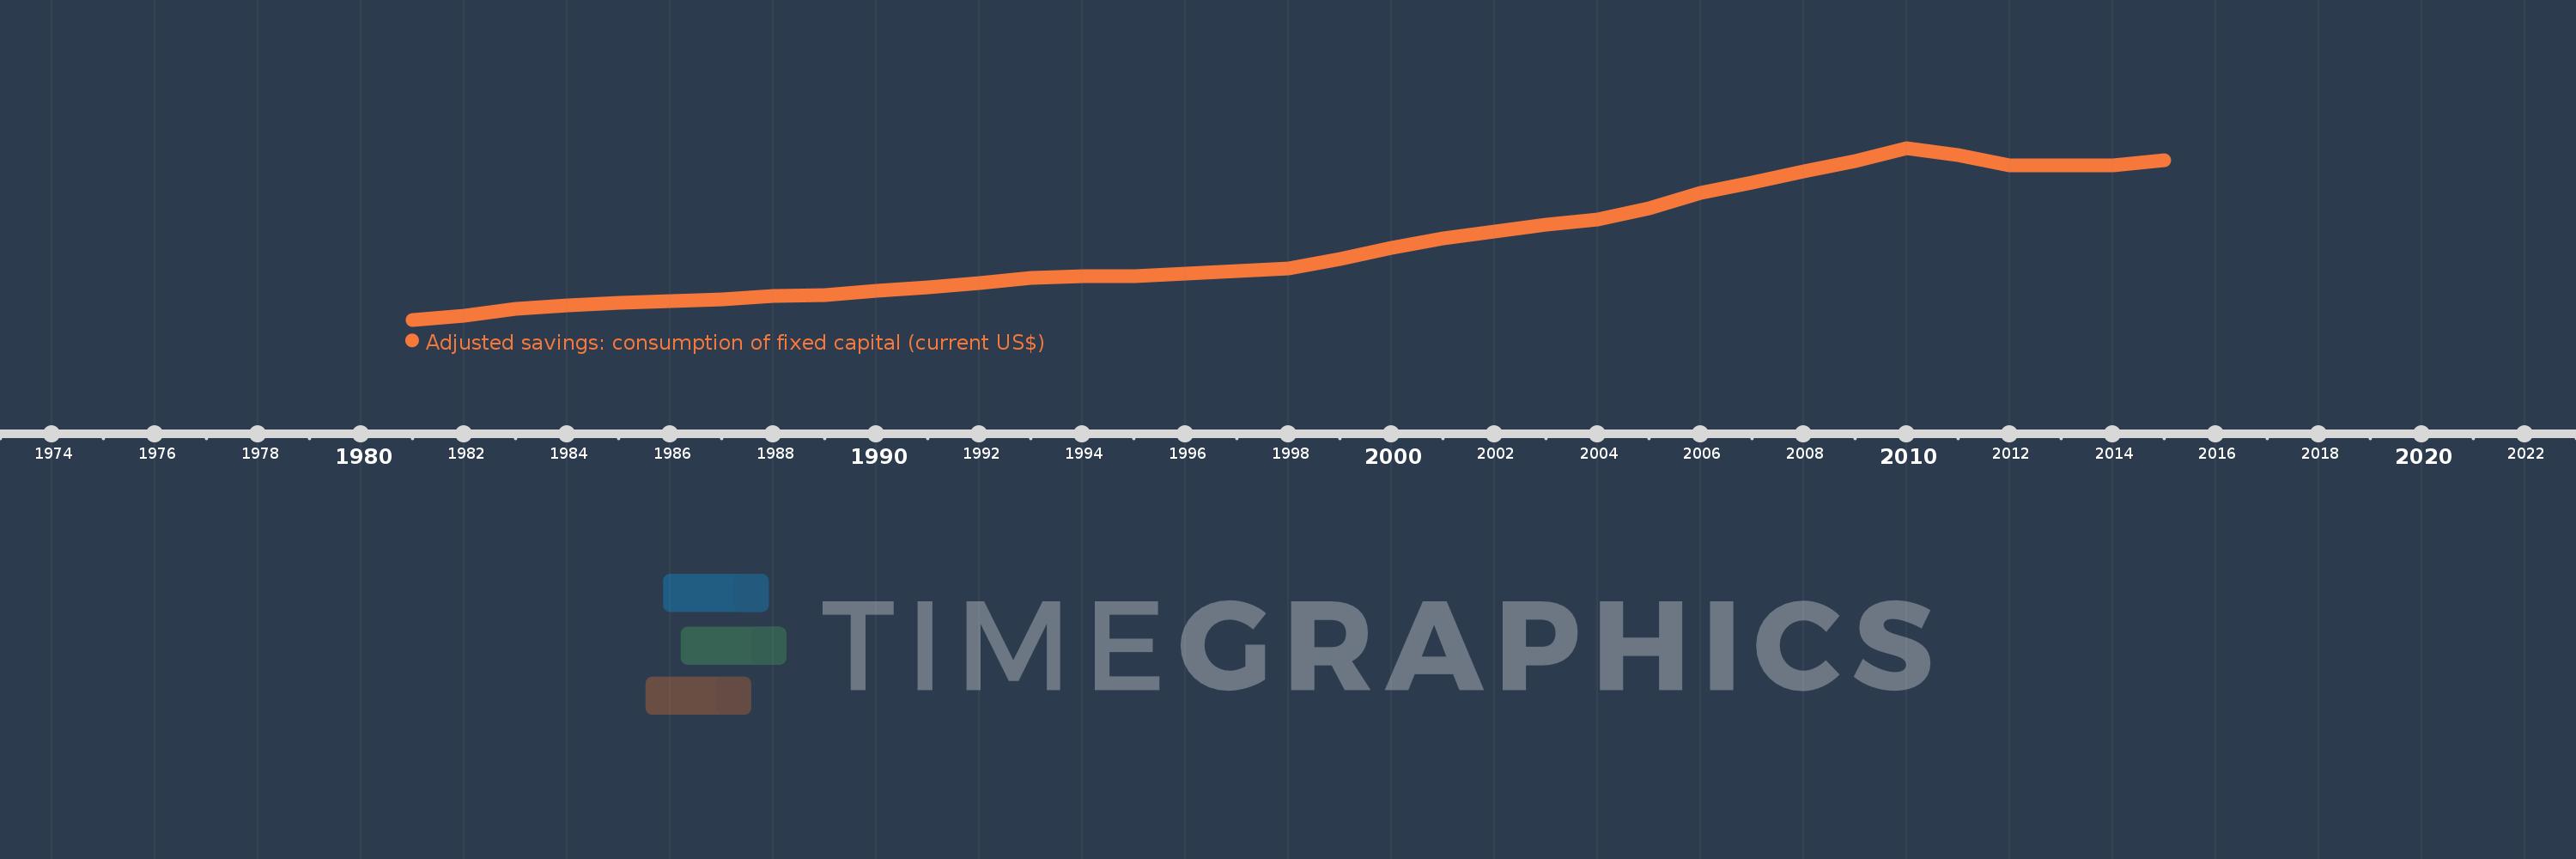
Adjusted savings: consumption of fixed capital (current US$)
2015,2014,2013,2012,2011,2010,2009,2008,2007,2006,2005,2004,2003,2002,2001,2000,1999,1998,1997,1996,1995,1994,1993,1992,1991,1990,1989,1988,1987,1986,1985,1984,1983,1982,1981
This statistics in other country:
AfghanistanAlbaniaAlgeriaAndorraAngolaAntigua and BarbudaArgentinaArmeniaArubaAustraliaAustriaAzerbaijanBahamas, TheBahrainBangladeshBarbadosBelarusBelgiumBelizeBeninBermudaBhutanBoliviaBosnia and HerzegovinaBotswanaBrazilBrunei DarussalamBulgariaBurkina FasoBurundiCabo VerdeCambodiaCameroonCanadaCayman IslandsCentral African RepublicChadChannel IslandsChileChinaColombiaComorosCongo, Dem. Rep.Congo, Rep.Costa RicaCote d'IvoireCroatiaCubaCyprusCzech RepublicDenmarkDjiboutiDominicaDominican RepublicEcuadorEgypt, Arab Rep.El SalvadorEquatorial GuineaEritreaEstoniaEthiopiaFaroe IslandsFijiFinlandFranceFrench PolynesiaGabonGambia, TheGeorgiaGermanyGhanaGreeceGreenlandGrenadaGuatemalaGuineaGuinea-BissauGuyanaHaitiHondurasHong Kong SAR, ChinaHungaryIcelandIndiaIndonesiaIran, Islamic Rep.IraqIrelandIsle of ManIsraelItalyJamaicaJapanJordanKazakhstanKenyaKiribatiKorea, Rep.KosovoKuwaitKyrgyz RepublicLao PDRLatviaLebanonLesothoLiberiaLibyaLiechtensteinLithuaniaLuxembourgMacao SAR, ChinaMacedonia, FYRMadagascarMalawiMalaysiaMaldivesMaliMaltaMarshall IslandsMauritaniaMauritiusMexicoMicronesia, Fed. Sts.MoldovaMonacoMongoliaMontenegroMoroccoMozambiqueMyanmarNamibiaNepalNetherlandsNew CaledoniaNew ZealandNicaraguaNigerNigeriaNorwayOmanPakistanPalauPanamaPapua New GuineaParaguayPeruPhilippinesPolandPortugalPuerto RicoQatarRomaniaRussian FederationRwandaSamoaSan MarinoSao Tome and PrincipeSaudi ArabiaSenegalSerbiaSeychellesSierra LeoneSingaporeSlovak RepublicSloveniaSolomon IslandsSomaliaSouth AfricaSouth SudanSpainSri LankaSt. Kitts and NevisSt. LuciaSt. Vincent and the GrenadinesSudanSurinameSwazilandSwedenSwitzerlandSyrian Arab RepublicTajikistanTanzaniaThailandTimor-LesteTogoTongaTrinidad and TobagoTunisiaTurkeyTurkmenistanTuvaluUgandaUkraineUnited Arab EmiratesUnited KingdomUnited StatesUruguayUzbekistanVanuatuVenezuela, RBVietnamVirgin Islands (U.S.)West Bank and GazaYemen, Rep.ZambiaZimbabwe Timeline:
This timeline shows a graph from 1981 to 2015 of Barbados. No data until 1980. Number of actual observations by date: 35.
Source name:
World Development Indicators
Source organization:
World Bank staff estimates using data from the United Nations Statistics Division's National Accounts Statistics.
Categories, topics:
Economy & Growth, Environment
Last updated:
apr 23, 2017
Indicators value changes by year
Minimum:
18.396 mln
jan 1, 1981
Maximum:
151.848 mln
jan 1, 2010
At the date of observation
Value
Absolute change
Change from previous value
jan 1, 1981
18.396 mln
+18.396 mln
0.0%
jan 1, 1982
21.688 mln
+3.292 mln
17.89%
jan 1, 1983
26.697 mln
+5.009 mln
23.1%
jan 1, 1984
29.814 mln
+3.116 mln
11.67%
jan 1, 1985
31.731 mln
+1.918 mln
6.43%
jan 1, 1986
32.915 mln
+1.184 mln
3.73%
jan 1, 1987
33.933 mln
+1.018 mln
3.09%
jan 1, 1988
36.692 mln
+2.759 mln
8.13%
jan 1, 1989
37.864 mln
+1.172 mln
3.19%
jan 1, 1990
40.776 mln
+2.912 mln
7.69%
jan 1, 1991
43.683 mln
+2.907 mln
7.13%
jan 1, 1992
47.113 mln
+3.43 mln
7.85%
jan 1, 1993
51.2 mln
+4.087 mln
8.67%
jan 1, 1994
52.132 mln
+931.797K
1.82%
jan 1, 1995
52.077 mln
-54.519K
-0.1%
jan 1, 1996
53.913 mln
+1.835 mln
3.52%
jan 1, 1997
56.538 mln
+2.625 mln
4.87%
jan 1, 1998
58.313 mln
+1.776 mln
3.14%
jan 1, 1999
65.839 mln
+7.526 mln
12.91%
jan 1, 2000
74.033 mln
+8.193 mln
12.44%
jan 1, 2001
81.412 mln
+7.38 mln
9.97%
jan 1, 2002
87.156 mln
+5.744 mln
7.06%
jan 1, 2003
92.295 mln
+5.139 mln
5.9%
jan 1, 2004
96.154 mln
+3.859 mln
4.18%
jan 1, 2005
105.209 mln
+9.055 mln
9.42%
jan 1, 2006
116.696 mln
+11.487 mln
10.92%
jan 1, 2007
125.272 mln
+8.576 mln
7.35%
jan 1, 2008
133.532 mln
+8.26 mln
6.59%
jan 1, 2009
141.942 mln
+8.41 mln
6.3%
jan 1, 2010
151.848 mln
+9.906 mln
6.98%
jan 1, 2011
146.028 mln
-5.819 mln
-3.83%
jan 1, 2012
138.405 mln
-7.623 mln
-5.22%
jan 1, 2013
138.224 mln
-180.793K
-0.13%
jan 1, 2014
138.438 mln
+213.548K
0.15%
jan 1, 2015
142.075 mln
+3.637 mln
2.63%
Ranking of countries by current statistics by years


Comments: