29
/
en
AIzaSyAYiBZKx7MnpbEhh9jyipgxe19OcubqV5w
April 1, 2024
89435
Botswana
BWA
true
2
1
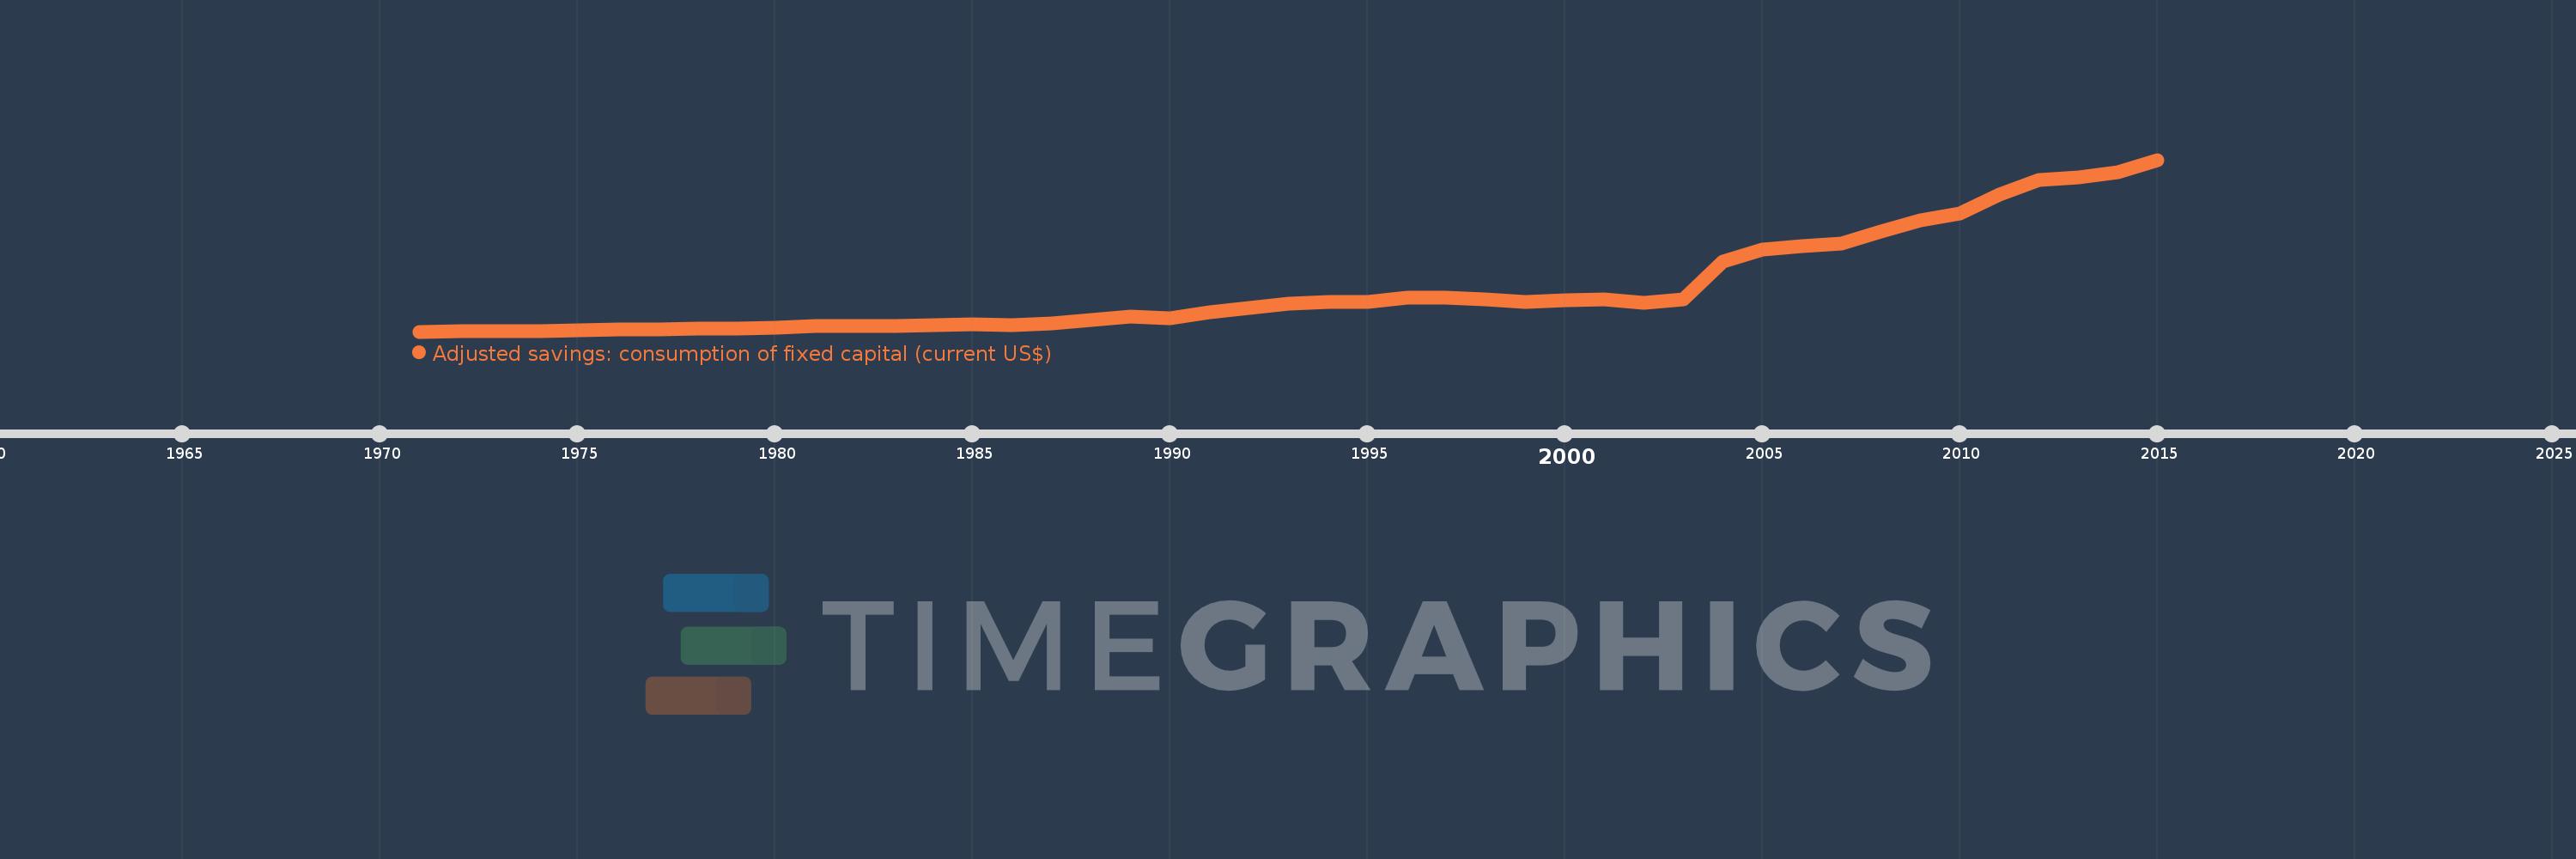
Adjusted savings: consumption of fixed capital (current US$)
2015,2014,2013,2012,2011,2010,2009,2008,2007,2006,2005,2004,2003,2002,2001,2000,1999,1998,1997,1996,1995,1994,1993,1992,1991,1990,1989,1988,1987,1986,1985,1984,1983,1982,1981,1980,1979,1978,1977,1976,1975,1974,1973,1972,1971
This statistics in other country:
AfghanistanAlbaniaAlgeriaAndorraAngolaAntigua and BarbudaArgentinaArmeniaArubaAustraliaAustriaAzerbaijanBahamas, TheBahrainBangladeshBarbadosBelarusBelgiumBelizeBeninBermudaBhutanBoliviaBosnia and HerzegovinaBotswanaBrazilBrunei DarussalamBulgariaBurkina FasoBurundiCabo VerdeCambodiaCameroonCanadaCayman IslandsCentral African RepublicChadChannel IslandsChileChinaColombiaComorosCongo, Dem. Rep.Congo, Rep.Costa RicaCote d'IvoireCroatiaCubaCyprusCzech RepublicDenmarkDjiboutiDominicaDominican RepublicEcuadorEgypt, Arab Rep.El SalvadorEquatorial GuineaEritreaEstoniaEthiopiaFaroe IslandsFijiFinlandFranceFrench PolynesiaGabonGambia, TheGeorgiaGermanyGhanaGreeceGreenlandGrenadaGuatemalaGuineaGuinea-BissauGuyanaHaitiHondurasHong Kong SAR, ChinaHungaryIcelandIndiaIndonesiaIran, Islamic Rep.IraqIrelandIsle of ManIsraelItalyJamaicaJapanJordanKazakhstanKenyaKiribatiKorea, Rep.KosovoKuwaitKyrgyz RepublicLao PDRLatviaLebanonLesothoLiberiaLibyaLiechtensteinLithuaniaLuxembourgMacao SAR, ChinaMacedonia, FYRMadagascarMalawiMalaysiaMaldivesMaliMaltaMarshall IslandsMauritaniaMauritiusMexicoMicronesia, Fed. Sts.MoldovaMonacoMongoliaMontenegroMoroccoMozambiqueMyanmarNamibiaNepalNetherlandsNew CaledoniaNew ZealandNicaraguaNigerNigeriaNorwayOmanPakistanPalauPanamaPapua New GuineaParaguayPeruPhilippinesPolandPortugalPuerto RicoQatarRomaniaRussian FederationRwandaSamoaSan MarinoSao Tome and PrincipeSaudi ArabiaSenegalSerbiaSeychellesSierra LeoneSingaporeSlovak RepublicSloveniaSolomon IslandsSomaliaSouth AfricaSouth SudanSpainSri LankaSt. Kitts and NevisSt. LuciaSt. Vincent and the GrenadinesSudanSurinameSwazilandSwedenSwitzerlandSyrian Arab RepublicTajikistanTanzaniaThailandTimor-LesteTogoTongaTrinidad and TobagoTunisiaTurkeyTurkmenistanTuvaluUgandaUkraineUnited Arab EmiratesUnited KingdomUnited StatesUruguayUzbekistanVanuatuVenezuela, RBVietnamVirgin Islands (U.S.)West Bank and GazaYemen, Rep.ZambiaZimbabwe Timeline:
This timeline shows a graph from 1971 to 2015 of Botswana. No data until 1970. Number of actual observations by date: 45.
Source name:
World Development Indicators
Source organization:
World Bank staff estimates using data from the United Nations Statistics Division's National Accounts Statistics.
Categories, topics:
Economy & Growth, Environment
Last updated:
apr 23, 2017
Indicators value changes by year
Minimum:
10.435 mln
jan 1, 1971
Maximum:
3.291 bln
jan 1, 2015
At the date of observation
Value
Absolute change
Change from previous value
jan 1, 1971
10.435 mln
+10.435 mln
0.0%
jan 1, 1972
12.155 mln
+1.72 mln
16.48%
jan 1, 1973
16.267 mln
+4.111 mln
33.82%
jan 1, 1974
26.307 mln
+10.041 mln
61.73%
jan 1, 1975
41.496 mln
+15.188 mln
57.73%
jan 1, 1976
50.985 mln
+9.489 mln
22.87%
jan 1, 1977
53.022 mln
+2.038 mln
4.0%
jan 1, 1978
61.261 mln
+8.239 mln
15.54%
jan 1, 1979
74.18 mln
+12.919 mln
21.09%
jan 1, 1980
91.862 mln
+17.682 mln
23.84%
jan 1, 1981
111.851 mln
+19.989 mln
21.76%
jan 1, 1982
112.36 mln
+509.246K
0.46%
jan 1, 1983
115.898 mln
+3.537 mln
3.15%
jan 1, 1984
141.593 mln
+25.696 mln
22.17%
jan 1, 1985
146.266 mln
+4.672 mln
3.3%
jan 1, 1986
126.252 mln
-20.014 mln
-13.68%
jan 1, 1987
161.764 mln
+35.512 mln
28.13%
jan 1, 1988
233.617 mln
+71.853 mln
44.42%
jan 1, 1989
295.003 mln
+61.386 mln
26.28%
jan 1, 1990
266.546 mln
-28.457 mln
-9.65%
jan 1, 1991
384.741 mln
+118.195 mln
44.34%
jan 1, 1992
460.0 mln
+75.259 mln
19.56%
jan 1, 1993
547.984 mln
+87.984 mln
19.13%
jan 1, 1994
568.23 mln
+20.246 mln
3.69%
jan 1, 1995
572.121 mln
+3.891 mln
0.68%
jan 1, 1996
663.853 mln
+91.732 mln
16.03%
jan 1, 1997
659.932 mln
-3.92 mln
-0.59%
jan 1, 1998
627.535 mln
-32.398 mln
-4.91%
jan 1, 1999
577.336 mln
-50.198 mln
-8.0%
jan 1, 2000
610.948 mln
+33.611 mln
5.82%
jan 1, 2001
628.384 mln
+17.436 mln
2.85%
jan 1, 2002
556.793 mln
-71.591 mln
-11.39%
jan 1, 2003
618.65 mln
+61.858 mln
11.11%
jan 1, 2004
1.354 bln
+735.646 mln
118.91%
jan 1, 2005
1.572 bln
+217.638 mln
16.07%
jan 1, 2006
1.635 bln
+62.726 mln
3.99%
jan 1, 2007
1.693 bln
+57.87 mln
3.54%
jan 1, 2008
1.919 bln
+226.966 mln
13.41%
jan 1, 2009
2.131 bln
+211.667 mln
11.03%
jan 1, 2010
2.267 bln
+136.205 mln
6.39%
jan 1, 2011
2.619 bln
+351.64 mln
15.51%
jan 1, 2012
2.907 bln
+288.169 mln
11.0%
jan 1, 2013
2.956 bln
+48.825 mln
1.68%
jan 1, 2014
3.058 bln
+101.61 mln
3.44%
jan 1, 2015
3.291 bln
+233.195 mln
7.63%
Ranking of countries by current statistics by years


Comments: