29
/
en
AIzaSyAYiBZKx7MnpbEhh9jyipgxe19OcubqV5w
April 1, 2024
103229
Chad
TCD
true
2
1
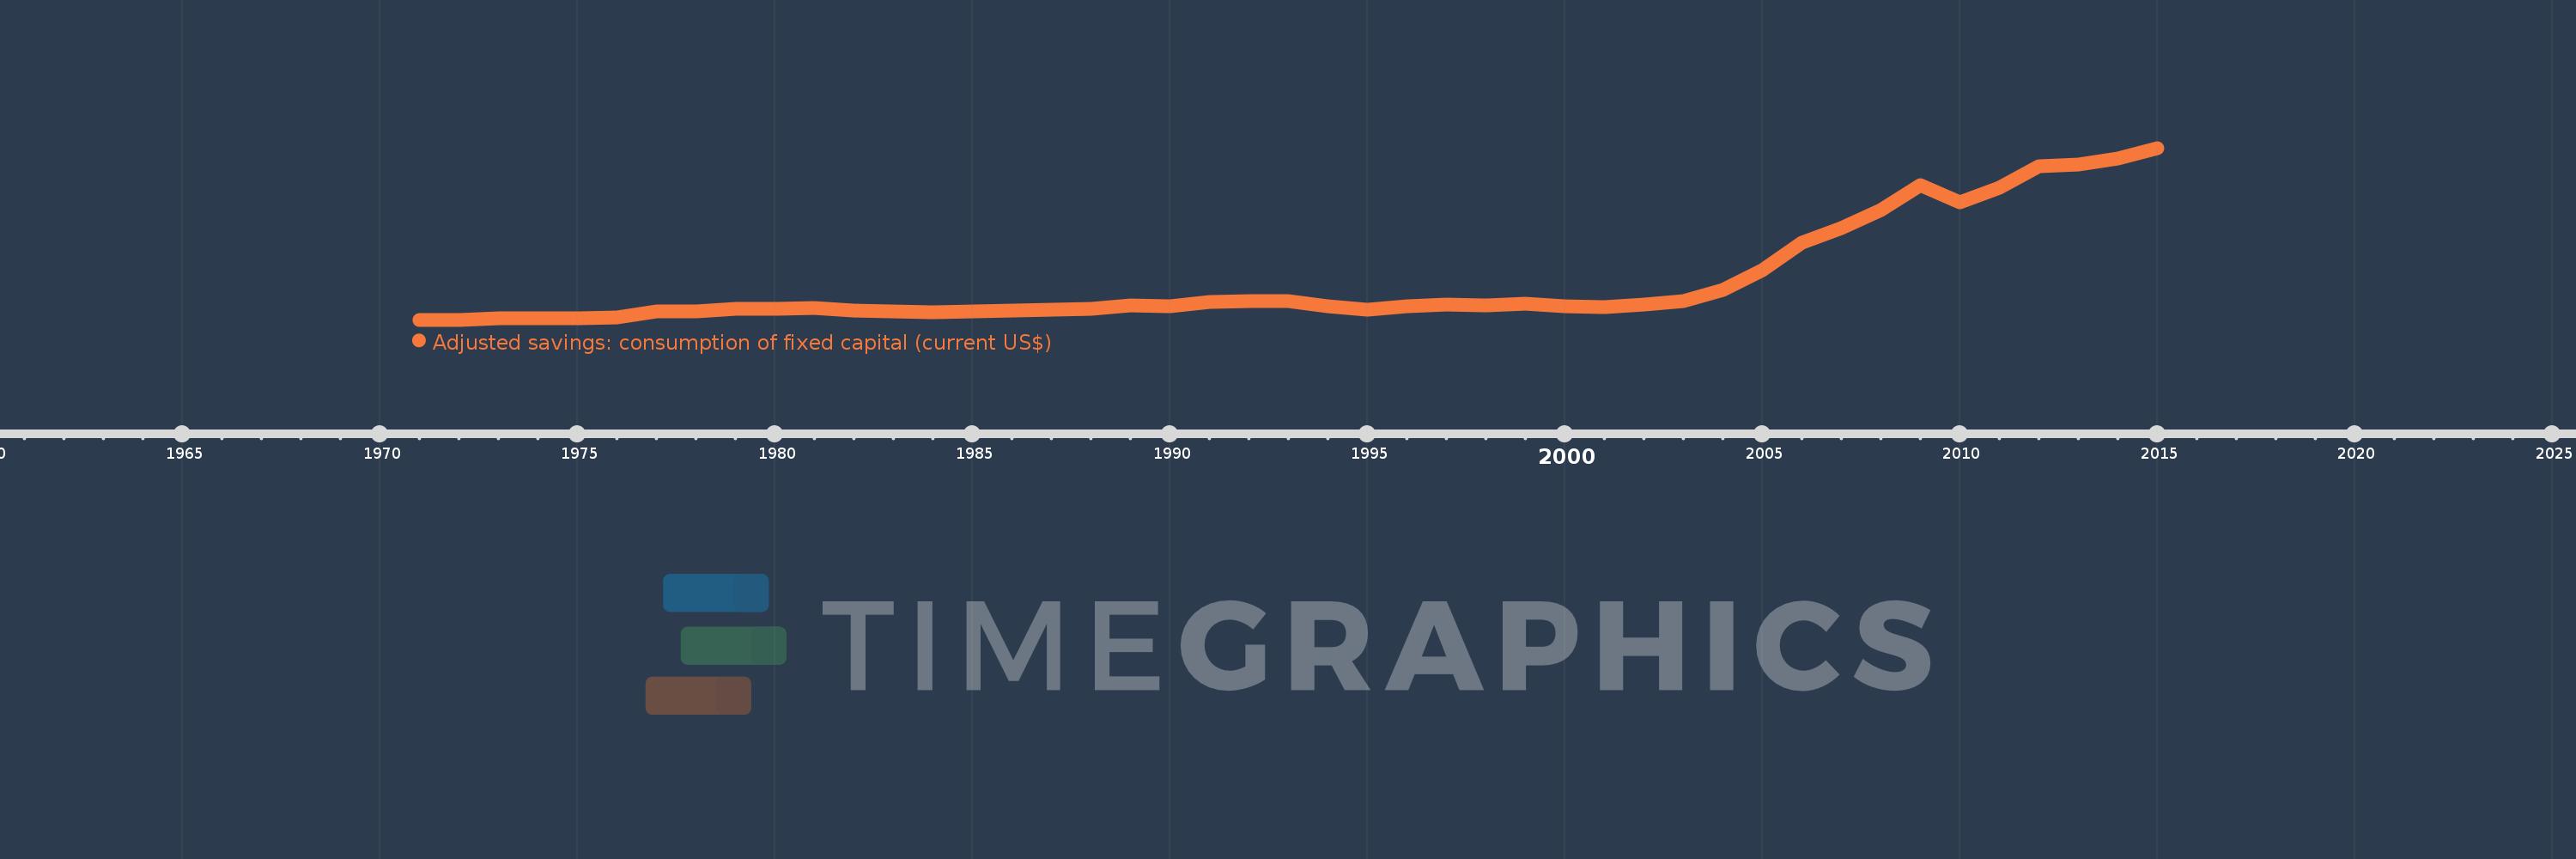
Adjusted savings: consumption of fixed capital (current US$)
2015,2014,2013,2012,2011,2010,2009,2008,2007,2006,2005,2004,2003,2002,2001,2000,1999,1998,1997,1996,1995,1994,1993,1992,1991,1990,1989,1988,1987,1986,1985,1984,1983,1982,1981,1980,1979,1978,1977,1976,1975,1974,1973,1972,1971
This statistics in other country:
AfghanistanAlbaniaAlgeriaAndorraAngolaAntigua and BarbudaArgentinaArmeniaArubaAustraliaAustriaAzerbaijanBahamas, TheBahrainBangladeshBarbadosBelarusBelgiumBelizeBeninBermudaBhutanBoliviaBosnia and HerzegovinaBotswanaBrazilBrunei DarussalamBulgariaBurkina FasoBurundiCabo VerdeCambodiaCameroonCanadaCayman IslandsCentral African RepublicChadChannel IslandsChileChinaColombiaComorosCongo, Dem. Rep.Congo, Rep.Costa RicaCote d'IvoireCroatiaCubaCyprusCzech RepublicDenmarkDjiboutiDominicaDominican RepublicEcuadorEgypt, Arab Rep.El SalvadorEquatorial GuineaEritreaEstoniaEthiopiaFaroe IslandsFijiFinlandFranceFrench PolynesiaGabonGambia, TheGeorgiaGermanyGhanaGreeceGreenlandGrenadaGuatemalaGuineaGuinea-BissauGuyanaHaitiHondurasHong Kong SAR, ChinaHungaryIcelandIndiaIndonesiaIran, Islamic Rep.IraqIrelandIsle of ManIsraelItalyJamaicaJapanJordanKazakhstanKenyaKiribatiKorea, Rep.KosovoKuwaitKyrgyz RepublicLao PDRLatviaLebanonLesothoLiberiaLibyaLiechtensteinLithuaniaLuxembourgMacao SAR, ChinaMacedonia, FYRMadagascarMalawiMalaysiaMaldivesMaliMaltaMarshall IslandsMauritaniaMauritiusMexicoMicronesia, Fed. Sts.MoldovaMonacoMongoliaMontenegroMoroccoMozambiqueMyanmarNamibiaNepalNetherlandsNew CaledoniaNew ZealandNicaraguaNigerNigeriaNorwayOmanPakistanPalauPanamaPapua New GuineaParaguayPeruPhilippinesPolandPortugalPuerto RicoQatarRomaniaRussian FederationRwandaSamoaSan MarinoSao Tome and PrincipeSaudi ArabiaSenegalSerbiaSeychellesSierra LeoneSingaporeSlovak RepublicSloveniaSolomon IslandsSomaliaSouth AfricaSouth SudanSpainSri LankaSt. Kitts and NevisSt. LuciaSt. Vincent and the GrenadinesSudanSurinameSwazilandSwedenSwitzerlandSyrian Arab RepublicTajikistanTanzaniaThailandTimor-LesteTogoTongaTrinidad and TobagoTunisiaTurkeyTurkmenistanTuvaluUgandaUkraineUnited Arab EmiratesUnited KingdomUnited StatesUruguayUzbekistanVanuatuVenezuela, RBVietnamVirgin Islands (U.S.)West Bank and GazaYemen, Rep.ZambiaZimbabwe Timeline:
This timeline shows a graph from 1971 to 2015 of Chad. No data until 1970. Number of actual observations by date: 45.
Source name:
World Development Indicators
Source organization:
World Bank staff estimates using data from the United Nations Statistics Division's National Accounts Statistics.
Categories, topics:
Economy & Growth, Environment
Last updated:
apr 23, 2017
Indicators value changes by year
Minimum:
19.77 mln
jan 1, 1971
Maximum:
880.165 mln
jan 1, 2015
At the date of observation
Value
Absolute change
Change from previous value
jan 1, 1971
19.77 mln
+19.77 mln
0.0%
jan 1, 1972
20.628 mln
+858.194K
4.34%
jan 1, 1973
25.129 mln
+4.501 mln
21.82%
jan 1, 1974
28.664 mln
+3.535 mln
14.07%
jan 1, 1975
26.028 mln
-2.636 mln
-9.19%
jan 1, 1976
30.87 mln
+4.842 mln
18.6%
jan 1, 1977
62.511 mln
+31.64 mln
102.49%
jan 1, 1978
60.625 mln
-1.885 mln
-3.02%
jan 1, 1979
72.731 mln
+12.106 mln
19.97%
jan 1, 1980
74.127 mln
+1.396 mln
1.92%
jan 1, 1981
78.604 mln
+4.477 mln
6.04%
jan 1, 1982
66.118 mln
-12.486 mln
-15.88%
jan 1, 1983
61.06 mln
-5.058 mln
-7.65%
jan 1, 1984
56.63 mln
-4.43 mln
-7.25%
jan 1, 1985
62.146 mln
+5.516 mln
9.74%
jan 1, 1986
64.139 mln
+1.993 mln
3.21%
jan 1, 1987
68.119 mln
+3.98 mln
6.21%
jan 1, 1988
75.547 mln
+7.428 mln
10.9%
jan 1, 1989
90.896 mln
+15.349 mln
20.32%
jan 1, 1990
86.918 mln
-3.978 mln
-4.38%
jan 1, 1991
108.379 mln
+21.462 mln
24.69%
jan 1, 1992
113.892 mln
+5.513 mln
5.09%
jan 1, 1993
111.534 mln
-2.358 mln
-2.07%
jan 1, 1994
88.378 mln
-23.156 mln
-20.76%
jan 1, 1995
70.302 mln
-18.076 mln
-20.45%
jan 1, 1996
86.522 mln
+16.22 mln
23.07%
jan 1, 1997
95.913 mln
+9.391 mln
10.85%
jan 1, 1998
90.707 mln
-5.205 mln
-5.43%
jan 1, 1999
100.726 mln
+10.019 mln
11.05%
jan 1, 2000
89.314 mln
-11.413 mln
-11.33%
jan 1, 2001
81.695 mln
-7.619 mln
-8.53%
jan 1, 2002
95.043 mln
+13.349 mln
16.34%
jan 1, 2003
111.23 mln
+16.186 mln
17.03%
jan 1, 2004
170.973 mln
+59.743 mln
53.71%
jan 1, 2005
266.999 mln
+96.026 mln
56.16%
jan 1, 2006
407.761 mln
+140.763 mln
52.72%
jan 1, 2007
479.675 mln
+71.914 mln
17.64%
jan 1, 2008
567.398 mln
+87.723 mln
18.29%
jan 1, 2009
691.918 mln
+124.52 mln
21.95%
jan 1, 2010
608.575 mln
-83.344 mln
-12.05%
jan 1, 2011
679.335 mln
+70.76 mln
11.63%
jan 1, 2012
790.527 mln
+111.192 mln
16.37%
jan 1, 2013
796.833 mln
+6.305 mln
0.8%
jan 1, 2014
826.503 mln
+29.671 mln
3.72%
jan 1, 2015
880.165 mln
+53.662 mln
6.49%
Ranking of countries by current statistics by years


Comments: