29
/
en
AIzaSyAYiBZKx7MnpbEhh9jyipgxe19OcubqV5w
April 1, 2024
130051
Ethiopia
ETH
true
2
1
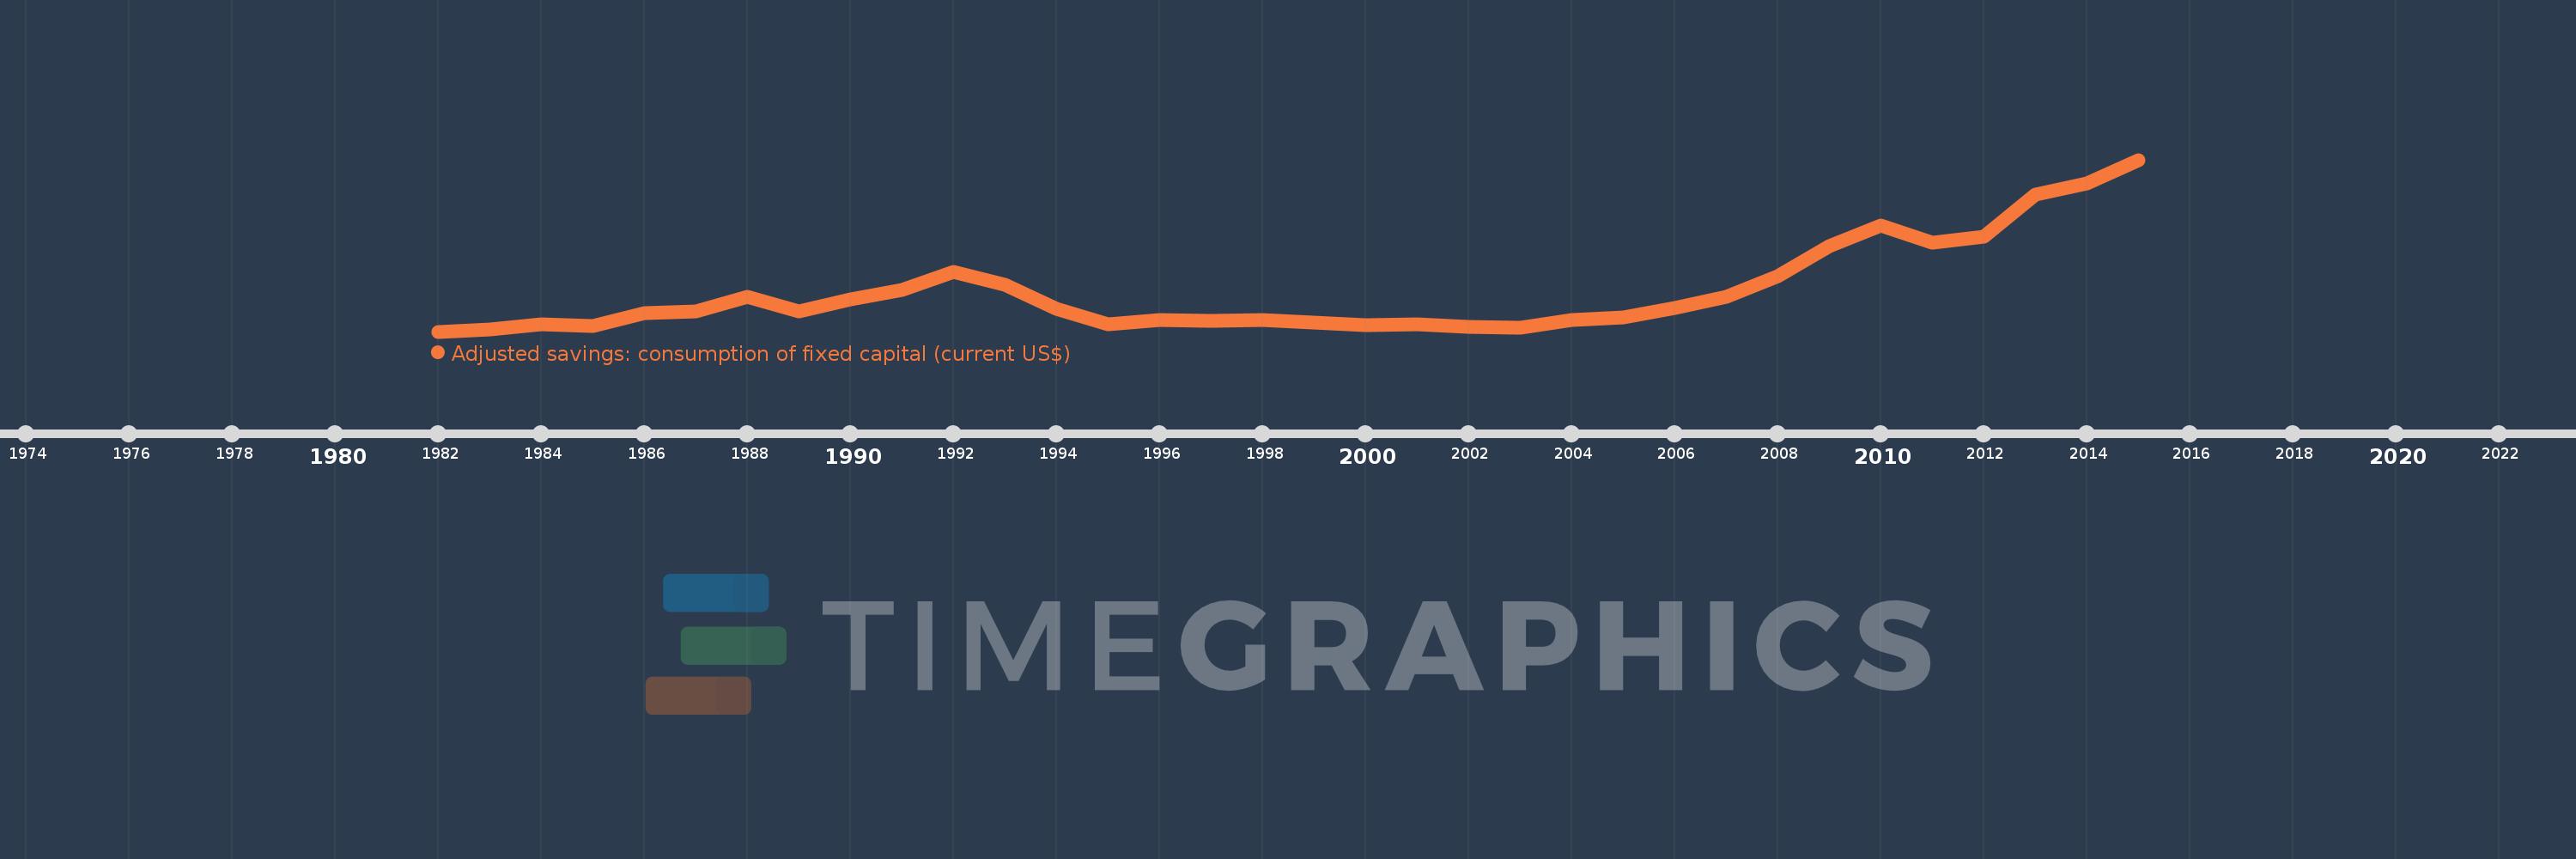
Adjusted savings: consumption of fixed capital (current US$)
2015,2014,2013,2012,2011,2010,2009,2008,2007,2006,2005,2004,2003,2002,2001,2000,1999,1998,1997,1996,1995,1994,1993,1992,1991,1990,1989,1988,1987,1986,1985,1984,1983,1982
This statistics in other country:
AfghanistanAlbaniaAlgeriaAndorraAngolaAntigua and BarbudaArgentinaArmeniaArubaAustraliaAustriaAzerbaijanBahamas, TheBahrainBangladeshBarbadosBelarusBelgiumBelizeBeninBermudaBhutanBoliviaBosnia and HerzegovinaBotswanaBrazilBrunei DarussalamBulgariaBurkina FasoBurundiCabo VerdeCambodiaCameroonCanadaCayman IslandsCentral African RepublicChadChannel IslandsChileChinaColombiaComorosCongo, Dem. Rep.Congo, Rep.Costa RicaCote d'IvoireCroatiaCubaCyprusCzech RepublicDenmarkDjiboutiDominicaDominican RepublicEcuadorEgypt, Arab Rep.El SalvadorEquatorial GuineaEritreaEstoniaEthiopiaFaroe IslandsFijiFinlandFranceFrench PolynesiaGabonGambia, TheGeorgiaGermanyGhanaGreeceGreenlandGrenadaGuatemalaGuineaGuinea-BissauGuyanaHaitiHondurasHong Kong SAR, ChinaHungaryIcelandIndiaIndonesiaIran, Islamic Rep.IraqIrelandIsle of ManIsraelItalyJamaicaJapanJordanKazakhstanKenyaKiribatiKorea, Rep.KosovoKuwaitKyrgyz RepublicLao PDRLatviaLebanonLesothoLiberiaLibyaLiechtensteinLithuaniaLuxembourgMacao SAR, ChinaMacedonia, FYRMadagascarMalawiMalaysiaMaldivesMaliMaltaMarshall IslandsMauritaniaMauritiusMexicoMicronesia, Fed. Sts.MoldovaMonacoMongoliaMontenegroMoroccoMozambiqueMyanmarNamibiaNepalNetherlandsNew CaledoniaNew ZealandNicaraguaNigerNigeriaNorwayOmanPakistanPalauPanamaPapua New GuineaParaguayPeruPhilippinesPolandPortugalPuerto RicoQatarRomaniaRussian FederationRwandaSamoaSan MarinoSao Tome and PrincipeSaudi ArabiaSenegalSerbiaSeychellesSierra LeoneSingaporeSlovak RepublicSloveniaSolomon IslandsSomaliaSouth AfricaSouth SudanSpainSri LankaSt. Kitts and NevisSt. LuciaSt. Vincent and the GrenadinesSudanSurinameSwazilandSwedenSwitzerlandSyrian Arab RepublicTajikistanTanzaniaThailandTimor-LesteTogoTongaTrinidad and TobagoTunisiaTurkeyTurkmenistanTuvaluUgandaUkraineUnited Arab EmiratesUnited KingdomUnited StatesUruguayUzbekistanVanuatuVenezuela, RBVietnamVirgin Islands (U.S.)West Bank and GazaYemen, Rep.ZambiaZimbabwe Timeline:
This timeline shows a graph from 1982 to 2015 of Ethiopia. No data until 1981. Number of actual observations by date: 34.
Source name:
World Development Indicators
Source organization:
World Bank staff estimates using data from the United Nations Statistics Division's National Accounts Statistics.
Categories, topics:
Economy & Growth, Environment
Last updated:
apr 23, 2017
Indicators value changes by year
Minimum:
580.961 mln
jan 1, 1982
Maximum:
2.991 bln
jan 1, 2015
At the date of observation
Value
Absolute change
Change from previous value
jan 1, 1982
580.961 mln
+580.961 mln
0.0%
jan 1, 1983
616.384 mln
+35.422 mln
6.1%
jan 1, 1984
689.221 mln
+72.838 mln
11.82%
jan 1, 1985
655.915 mln
-33.306 mln
-4.83%
jan 1, 1986
840.061 mln
+184.146 mln
28.07%
jan 1, 1987
860.957 mln
+20.896 mln
2.49%
jan 1, 1988
1.074 bln
+213.233 mln
24.77%
jan 1, 1989
868.201 mln
-205.989 mln
-19.18%
jan 1, 1990
1.035 bln
+166.58 mln
19.19%
jan 1, 1991
1.16 bln
+124.878 mln
12.07%
jan 1, 1992
1.424 bln
+264.471 mln
22.81%
jan 1, 1993
1.241 bln
-183.581 mln
-12.89%
jan 1, 1994
905.703 mln
-334.846 mln
-26.99%
jan 1, 1995
681.678 mln
-224.025 mln
-24.73%
jan 1, 1996
743.603 mln
+61.925 mln
9.08%
jan 1, 1997
728.957 mln
-14.646 mln
-1.97%
jan 1, 1998
743.823 mln
+14.866 mln
2.04%
jan 1, 1999
704.945 mln
-38.879 mln
-5.23%
jan 1, 2000
670.457 mln
-34.487 mln
-4.89%
jan 1, 2001
681.425 mln
+10.967 mln
1.64%
jan 1, 2002
649.551 mln
-31.873 mln
-4.68%
jan 1, 2003
633.742 mln
-15.809 mln
-2.43%
jan 1, 2004
746.951 mln
+113.21 mln
17.86%
jan 1, 2005
785.689 mln
+38.737 mln
5.19%
jan 1, 2006
917.602 mln
+131.913 mln
16.79%
jan 1, 2007
1.074 bln
+156.77 mln
17.08%
jan 1, 2008
1.352 bln
+277.805 mln
25.86%
jan 1, 2009
1.781 bln
+428.998 mln
31.73%
jan 1, 2010
2.069 bln
+287.969 mln
16.17%
jan 1, 2011
1.829 bln
-240.156 mln
-11.61%
jan 1, 2012
1.911 bln
+81.557 mln
4.46%
jan 1, 2013
2.503 bln
+592.307 mln
31.0%
jan 1, 2014
2.658 bln
+155.144 mln
6.2%
jan 1, 2015
2.991 bln
+332.787 mln
12.52%
Ranking of countries by current statistics by years


Comments: