29
/
en
AIzaSyAYiBZKx7MnpbEhh9jyipgxe19OcubqV5w
April 1, 2024
68556
Antigua and Barbuda
ATG
true
2
1
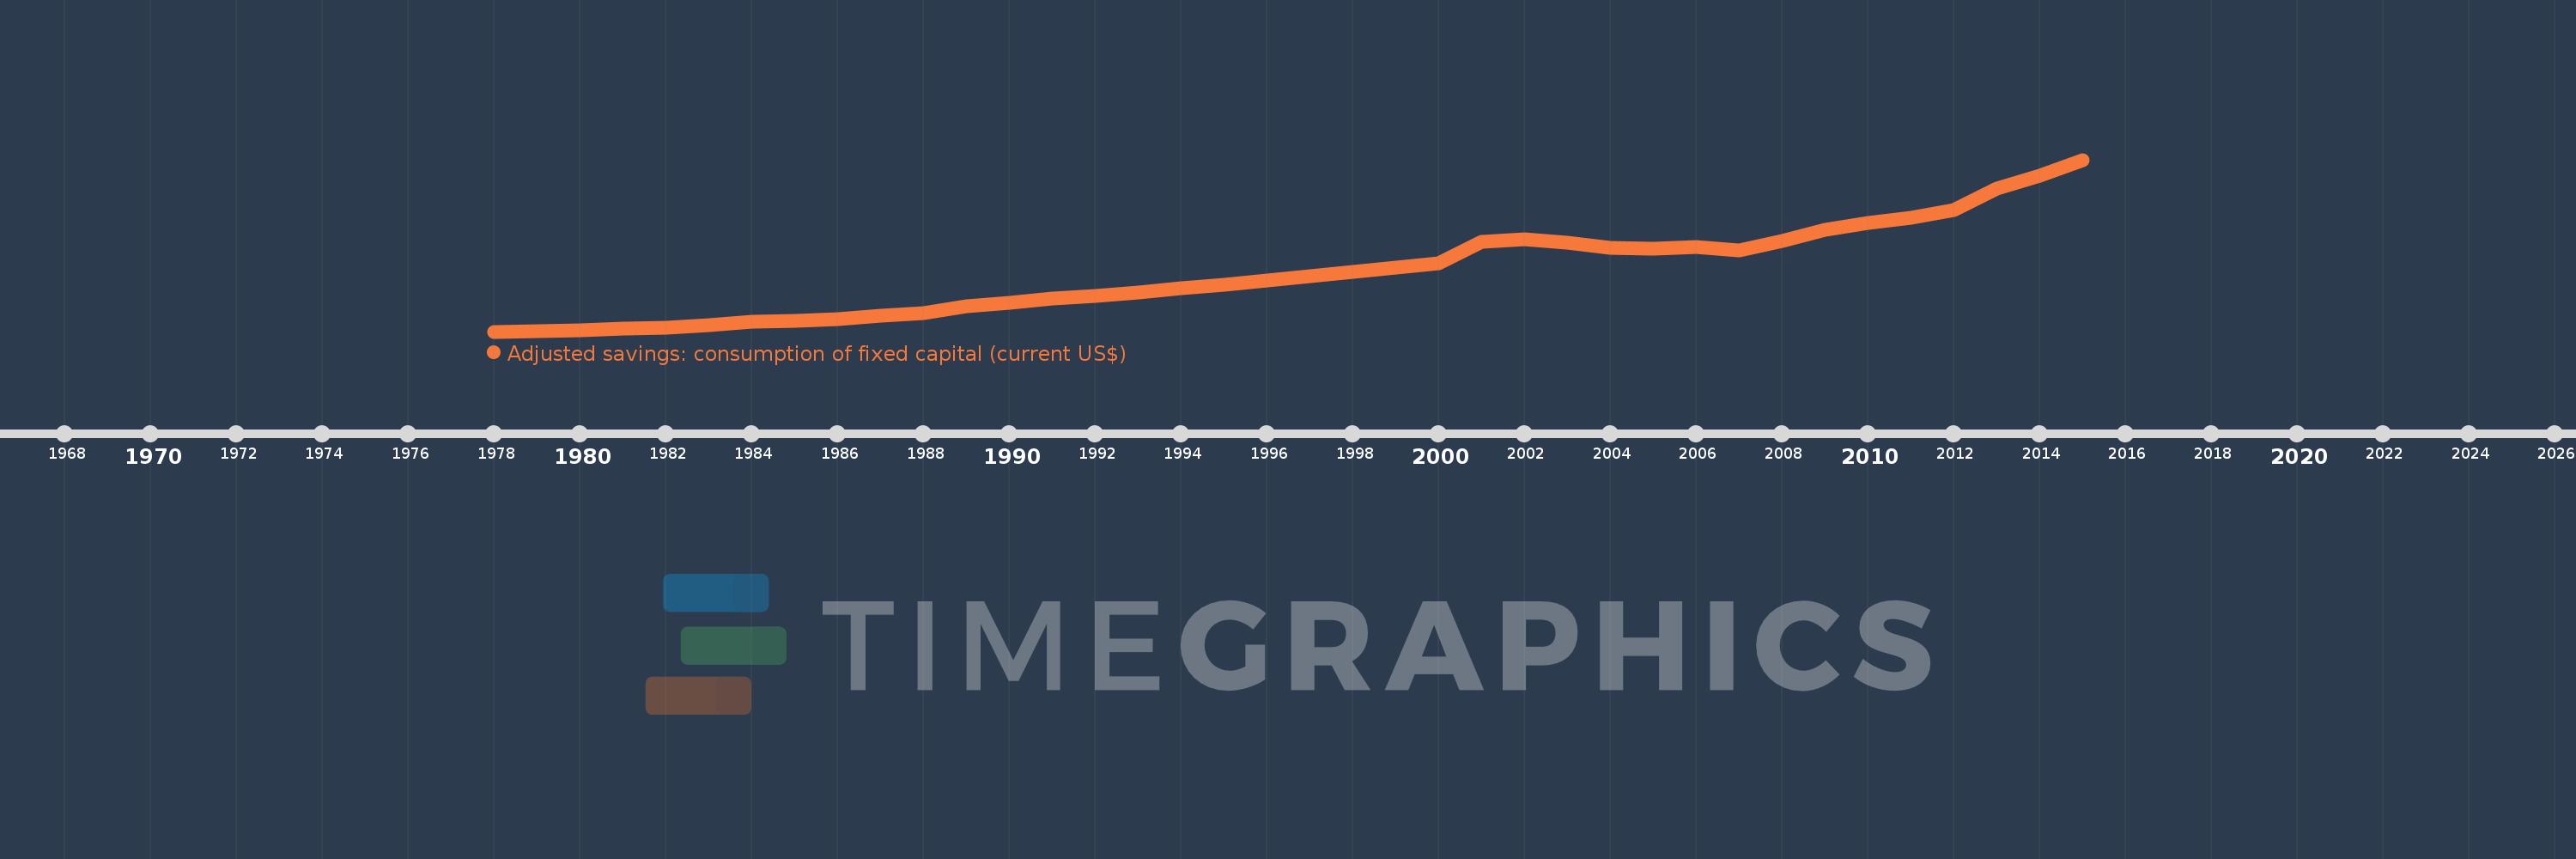
Adjusted savings: consumption of fixed capital (current US$)
2015,2014,2013,2012,2011,2010,2009,2008,2007,2006,2005,2004,2003,2002,2001,2000,1999,1998,1997,1996,1995,1994,1993,1992,1991,1990,1989,1988,1987,1986,1985,1984,1983,1982,1981,1980,1979,1978
This statistics in other country:
AfghanistanAlbaniaAlgeriaAndorraAngolaAntigua and BarbudaArgentinaArmeniaArubaAustraliaAustriaAzerbaijanBahamas, TheBahrainBangladeshBarbadosBelarusBelgiumBelizeBeninBermudaBhutanBoliviaBosnia and HerzegovinaBotswanaBrazilBrunei DarussalamBulgariaBurkina FasoBurundiCabo VerdeCambodiaCameroonCanadaCayman IslandsCentral African RepublicChadChannel IslandsChileChinaColombiaComorosCongo, Dem. Rep.Congo, Rep.Costa RicaCote d'IvoireCroatiaCubaCyprusCzech RepublicDenmarkDjiboutiDominicaDominican RepublicEcuadorEgypt, Arab Rep.El SalvadorEquatorial GuineaEritreaEstoniaEthiopiaFaroe IslandsFijiFinlandFranceFrench PolynesiaGabonGambia, TheGeorgiaGermanyGhanaGreeceGreenlandGrenadaGuatemalaGuineaGuinea-BissauGuyanaHaitiHondurasHong Kong SAR, ChinaHungaryIcelandIndiaIndonesiaIran, Islamic Rep.IraqIrelandIsle of ManIsraelItalyJamaicaJapanJordanKazakhstanKenyaKiribatiKorea, Rep.KosovoKuwaitKyrgyz RepublicLao PDRLatviaLebanonLesothoLiberiaLibyaLiechtensteinLithuaniaLuxembourgMacao SAR, ChinaMacedonia, FYRMadagascarMalawiMalaysiaMaldivesMaliMaltaMarshall IslandsMauritaniaMauritiusMexicoMicronesia, Fed. Sts.MoldovaMonacoMongoliaMontenegroMoroccoMozambiqueMyanmarNamibiaNepalNetherlandsNew CaledoniaNew ZealandNicaraguaNigerNigeriaNorwayOmanPakistanPalauPanamaPapua New GuineaParaguayPeruPhilippinesPolandPortugalPuerto RicoQatarRomaniaRussian FederationRwandaSamoaSan MarinoSao Tome and PrincipeSaudi ArabiaSenegalSerbiaSeychellesSierra LeoneSingaporeSlovak RepublicSloveniaSolomon IslandsSomaliaSouth AfricaSouth SudanSpainSri LankaSt. Kitts and NevisSt. LuciaSt. Vincent and the GrenadinesSudanSurinameSwazilandSwedenSwitzerlandSyrian Arab RepublicTajikistanTanzaniaThailandTimor-LesteTogoTongaTrinidad and TobagoTunisiaTurkeyTurkmenistanTuvaluUgandaUkraineUnited Arab EmiratesUnited KingdomUnited StatesUruguayUzbekistanVanuatuVenezuela, RBVietnamVirgin Islands (U.S.)West Bank and GazaYemen, Rep.ZambiaZimbabwe Timeline:
This timeline shows a graph from 1978 to 2015 of Antigua and Barbuda. No data until 1977. Number of actual observations by date: 38.
Source name:
World Development Indicators
Source organization:
World Bank staff estimates using data from the United Nations Statistics Division's National Accounts Statistics.
Categories, topics:
Economy & Growth, Environment
Last updated:
apr 23, 2017
Indicators value changes by year
Minimum:
4.554 mln
jan 1, 1978
Maximum:
163.3 mln
jan 1, 2015
At the date of observation
Value
Absolute change
Change from previous value
jan 1, 1978
4.554 mln
+4.554 mln
0.0%
jan 1, 1979
5.191 mln
+637.117K
13.99%
jan 1, 1980
5.516 mln
+324.656K
6.25%
jan 1, 1981
7.162 mln
+1.646 mln
29.84%
jan 1, 1982
8.268 mln
+1.106 mln
15.44%
jan 1, 1983
10.842 mln
+2.574 mln
31.13%
jan 1, 1984
13.808 mln
+2.965 mln
27.35%
jan 1, 1985
14.733 mln
+925.82K
6.71%
jan 1, 1986
16.356 mln
+1.623 mln
11.02%
jan 1, 1987
19.071 mln
+2.715 mln
16.6%
jan 1, 1988
21.887 mln
+2.816 mln
14.76%
jan 1, 1989
27.901 mln
+6.013 mln
27.47%
jan 1, 1990
30.948 mln
+3.047 mln
10.92%
jan 1, 1991
35.394 mln
+4.446 mln
14.37%
jan 1, 1992
37.134 mln
+1.74 mln
4.92%
jan 1, 1993
40.977 mln
+3.843 mln
10.35%
jan 1, 1994
44.42 mln
+3.444 mln
8.4%
jan 1, 1995
47.581 mln
+3.16 mln
7.11%
jan 1, 1996
51.614 mln
+4.034 mln
8.48%
jan 1, 1997
55.491 mln
+3.877 mln
7.51%
jan 1, 1998
59.689 mln
+4.197 mln
7.56%
jan 1, 1999
63.5 mln
+3.811 mln
6.39%
jan 1, 2000
67.377 mln
+3.877 mln
6.11%
jan 1, 2001
87.264 mln
+19.887 mln
29.52%
jan 1, 2002
89.833 mln
+2.569 mln
2.94%
jan 1, 2003
86.355 mln
-3.478 mln
-3.87%
jan 1, 2004
81.675 mln
-4.681 mln
-5.42%
jan 1, 2005
81.315 mln
-359.591K
-0.44%
jan 1, 2006
83.069 mln
+1.754 mln
2.16%
jan 1, 2007
79.914 mln
-3.155 mln
-3.8%
jan 1, 2008
88.131 mln
+8.217 mln
10.28%
jan 1, 2009
98.713 mln
+10.582 mln
12.01%
jan 1, 2010
104.667 mln
+5.954 mln
6.03%
jan 1, 2011
109.741 mln
+5.074 mln
4.85%
jan 1, 2012
116.952 mln
+7.211 mln
6.57%
jan 1, 2013
136.837 mln
+19.885 mln
17.0%
jan 1, 2014
148.471 mln
+11.633 mln
8.5%
jan 1, 2015
163.3 mln
+14.829 mln
9.99%
Ranking of countries by current statistics by years


Comments: