29
/
en
AIzaSyAYiBZKx7MnpbEhh9jyipgxe19OcubqV5w
April 1, 2024
96789
Burundi
BDI
true
2
1
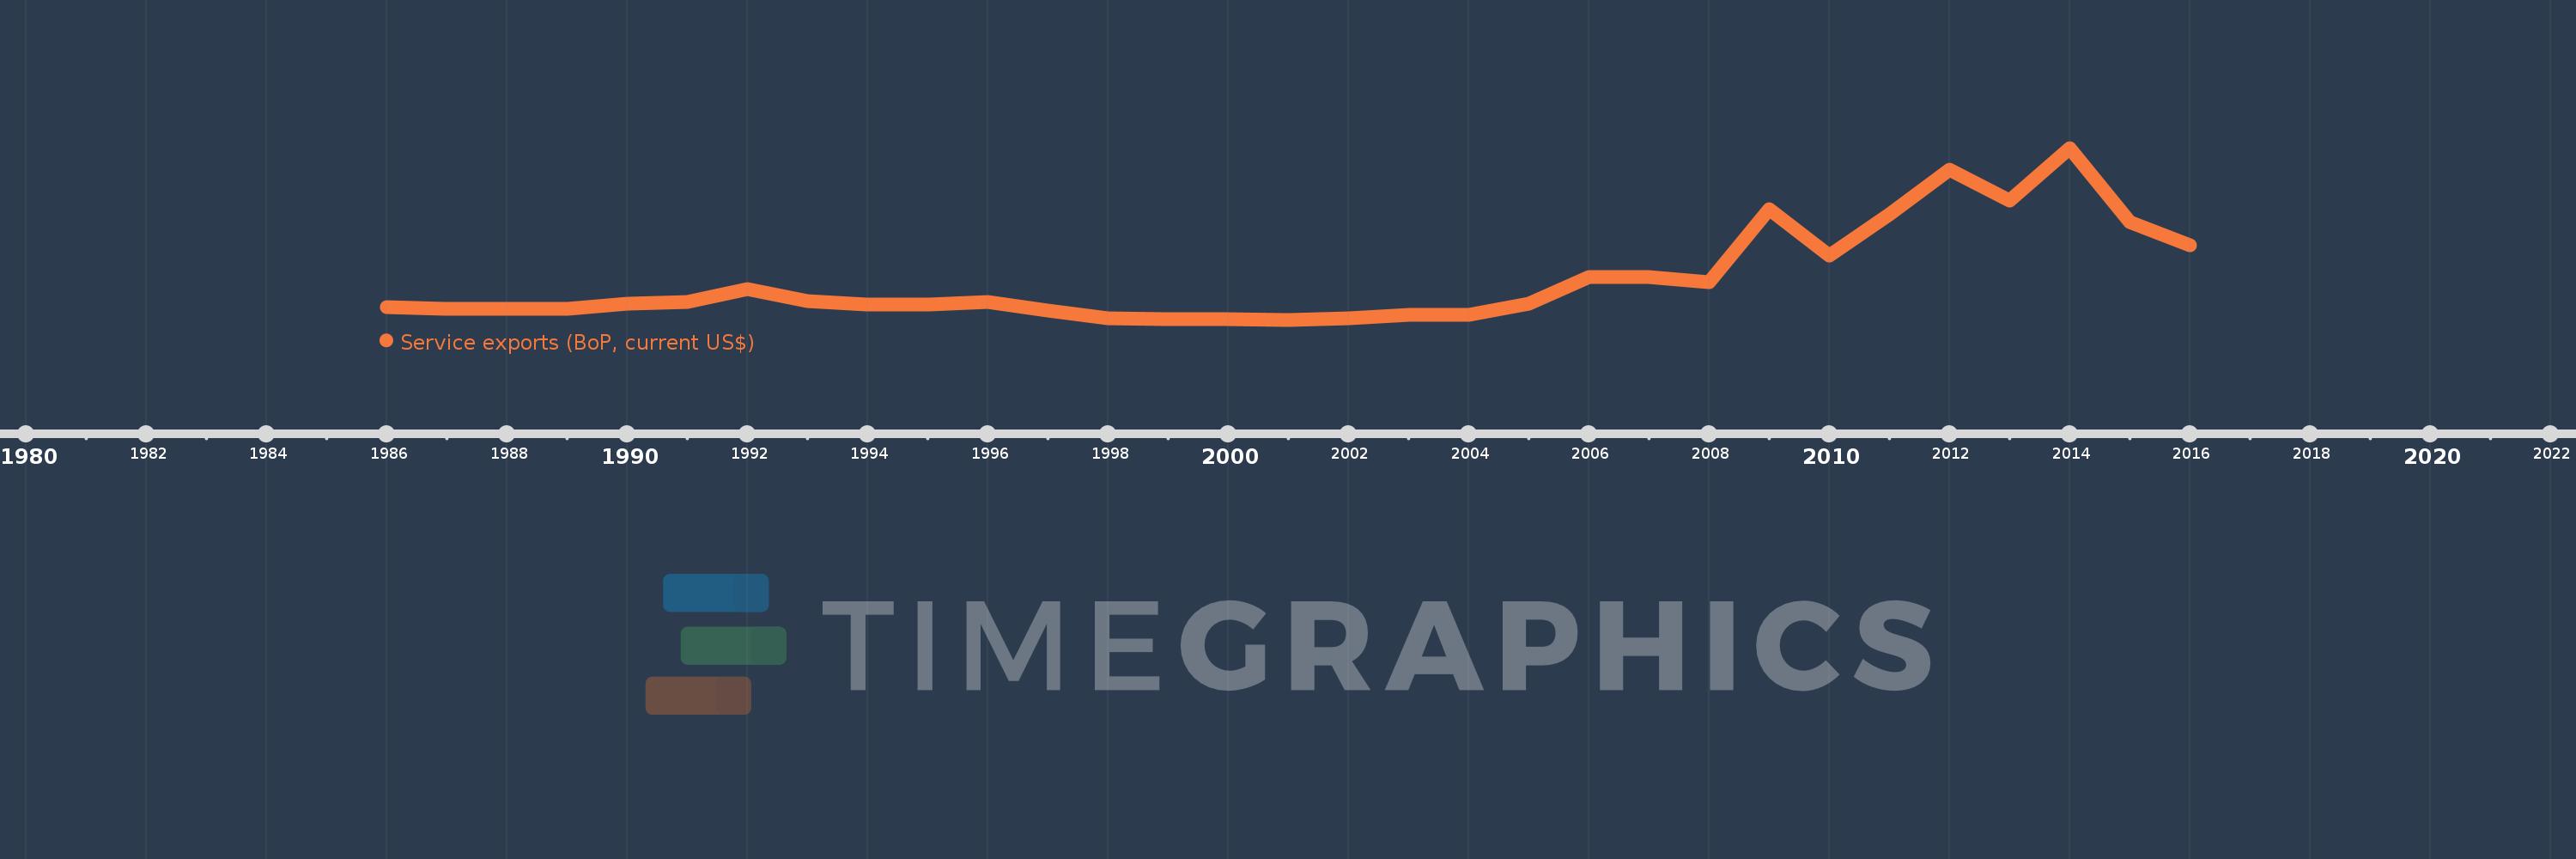
Service exports (BoP, current US$)
2016,2015,2014,2013,2012,2011,2010,2009,2008,2007,2006,2005,2004,2003,2002,2001,2000,1999,1998,1997,1996,1995,1994,1993,1992,1991,1990,1989,1988,1987,1986
This statistics in other country:
AfghanistanAlbaniaAlgeriaAngolaAntigua and BarbudaArab WorldArgentinaArmeniaArubaAustraliaAustriaAzerbaijanBahamas, TheBahrainBangladeshBarbadosBelarusBelgiumBelizeBeninBermudaBhutanBoliviaBosnia and HerzegovinaBotswanaBrazilBrunei DarussalamBulgariaBurkina FasoBurundiCabo VerdeCambodiaCameroonCanadaCaribbean small statesCentral African RepublicCentral Europe and the BalticsChadChileChinaColombiaComorosCongo, Dem. Rep.Congo, Rep.Costa RicaCote d'IvoireCroatiaCuracaoCyprusCzech RepublicDenmarkDjiboutiDominicaDominican RepublicEarly-demographic dividendEast Asia & PacificEast Asia & Pacific (excluding high income)East Asia & Pacific (IDA & IBRD countries)EcuadorEgypt, Arab Rep.El SalvadorEquatorial GuineaEritreaEstoniaEthiopiaEuro areaEurope & Central AsiaEurope & Central Asia (excluding high income)Europe & Central Asia (IDA & IBRD countries)European UnionFaroe IslandsFijiFinlandFragile and conflict affected situationsFranceFrench PolynesiaGabonGambia, TheGeorgiaGermanyGhanaGreeceGrenadaGuatemalaGuineaGuinea-BissauGuyanaHaitiHeavily indebted poor countries (HIPC)High incomeHondurasHong Kong SAR, ChinaHungaryIBRD onlyIcelandIDA & IBRD totalIDA blendIDA onlyIDA totalIndiaIndonesiaIran, Islamic Rep.IraqIrelandIsraelItalyJamaicaJapanJordanKazakhstanKenyaKiribatiKorea, Rep.KosovoKuwaitKyrgyz RepublicLao PDRLate-demographic dividendLatin America & Caribbean Latin America & Caribbean (excluding high income)Latin America & the Caribbean (IDA & IBRD countries)LatviaLeast developed countries: UN classificationLebanonLesothoLiberiaLibyaLithuaniaLow & middle incomeLow incomeLower middle incomeLuxembourgMacao SAR, ChinaMacedonia, FYRMadagascarMalawiMalaysiaMaldivesMaliMaltaMarshall IslandsMauritaniaMauritiusMexicoMicronesia, Fed. Sts.Middle East & North Africa (excluding high income)Middle East & North Africa (IDA & IBRD countries)Middle incomeMoldovaMongoliaMontenegroMoroccoMozambiqueMyanmarNamibiaNepalNetherlandsNew CaledoniaNew ZealandNicaraguaNigerNigeriaNorth AmericaNorwayOECD membersOmanPacific island small statesPakistanPalauPanamaPapua New GuineaParaguayPeruPhilippinesPolandPortugalPost-demographic dividendPre-demographic dividendQatarRomaniaRussian FederationRwandaSamoaSao Tome and PrincipeSaudi ArabiaSenegalSerbiaSeychellesSierra LeoneSingaporeSint Maarten (Dutch part)Slovak RepublicSloveniaSolomon IslandsSouth AfricaSouth AsiaSouth Asia (IDA & IBRD)South SudanSpainSri LankaSt. Kitts and NevisSt. LuciaSt. Vincent and the GrenadinesSub-Saharan Africa Sub-Saharan Africa (excluding high income)Sub-Saharan Africa (IDA & IBRD countries)SudanSurinameSwazilandSwedenSwitzerlandSyrian Arab RepublicTajikistanTanzaniaThailandTimor-LesteTogoTongaTrinidad and TobagoTunisiaTurkeyTuvaluUgandaUkraineUnited KingdomUnited StatesUpper middle incomeUruguayVanuatuVenezuela, RBVietnamWest Bank and GazaWorldYemen, Rep.ZambiaZimbabwe Timeline:
This timeline shows a graph from 1986 to 2016 of Burundi. No data until 1985. Number of actual observations by date: 31.
Source name:
World Development Indicators
Source organization:
International Monetary Fund, Balance of Payments Statistics Yearbook and data files.
Categories, topics:
Economy & Growth, Trade
Last updated:
apr 23, 2017
Indicators value changes by year
Minimum:
3.975 mln
jan 1, 2001
Maximum:
127.011 mln
jan 1, 2014
At the date of observation
Value
Absolute change
Change from previous value
jan 1, 1986
13.158 mln
+13.158 mln
0.0%
jan 1, 1987
11.737 mln
-1.421 mln
-10.8%
jan 1, 1988
11.913 mln
+176.099K
1.5%
jan 1, 1989
11.924 mln
+10.631K
0.09%
jan 1, 1990
15.315 mln
+3.392 mln
28.44%
jan 1, 1991
16.689 mln
+1.373 mln
8.97%
jan 1, 1992
25.657 mln
+8.968 mln
53.74%
jan 1, 1993
17.471 mln
-8.186 mln
-31.91%
jan 1, 1994
14.643 mln
-2.828 mln
-16.19%
jan 1, 1995
14.925 mln
+282.162K
1.93%
jan 1, 1996
16.448 mln
+1.523 mln
10.2%
jan 1, 1997
10.52 mln
-5.928 mln
-36.04%
jan 1, 1998
5.229 mln
-5.291 mln
-50.29%
jan 1, 1999
4.451 mln
-778.013K
-14.88%
jan 1, 2000
4.441 mln
-10.045K
-0.23%
jan 1, 2001
3.975 mln
-466.356K
-10.5%
jan 1, 2002
5.231 mln
+1.256 mln
31.61%
jan 1, 2003
7.511 mln
+2.28 mln
43.58%
jan 1, 2004
7.307 mln
-203.773K
-2.71%
jan 1, 2005
15.776 mln
+8.469 mln
115.89%
jan 1, 2006
34.793 mln
+19.017 mln
120.54%
jan 1, 2007
34.491 mln
-301.446K
-0.87%
jan 1, 2008
30.795 mln
-3.696 mln
-10.72%
jan 1, 2009
83.324 mln
+52.529 mln
170.57%
jan 1, 2010
49.932 mln
-33.392 mln
-40.08%
jan 1, 2011
79.492 mln
+29.56 mln
59.2%
jan 1, 2012
111.682 mln
+32.191 mln
40.5%
jan 1, 2013
89.459 mln
-22.224 mln
-19.9%
jan 1, 2014
127.011 mln
+37.552 mln
41.98%
jan 1, 2015
74.111 mln
-52.9 mln
-41.65%
jan 1, 2016
57.289 mln
-16.822 mln
-22.7%
Ranking of countries by current statistics by years


Comments: