29
/
en
AIzaSyAYiBZKx7MnpbEhh9jyipgxe19OcubqV5w
April 1, 2024
40341
IDA total
IDA
false
2
1
Service exports (BoP, current US$)
2015,2014,2013,2012,2011,2010,2009,2008,2007,2006,2005,2004,2003,2002,2001,2000,1999,1998,1997,1996,1995,1994,1993,1992,1991,1990,1989,1988,1987,1986,1985,1984,1983,1982,1981,1980,1979,1978
This statistics in other country:
AfghanistanAlbaniaAlgeriaAngolaAntigua and BarbudaArab WorldArgentinaArmeniaArubaAustraliaAustriaAzerbaijanBahamas, TheBahrainBangladeshBarbadosBelarusBelgiumBelizeBeninBermudaBhutanBoliviaBosnia and HerzegovinaBotswanaBrazilBrunei DarussalamBulgariaBurkina FasoBurundiCabo VerdeCambodiaCameroonCanadaCaribbean small statesCentral African RepublicCentral Europe and the BalticsChadChileChinaColombiaComorosCongo, Dem. Rep.Congo, Rep.Costa RicaCote d'IvoireCroatiaCuracaoCyprusCzech RepublicDenmarkDjiboutiDominicaDominican RepublicEarly-demographic dividendEast Asia & PacificEast Asia & Pacific (excluding high income)East Asia & Pacific (IDA & IBRD countries)EcuadorEgypt, Arab Rep.El SalvadorEquatorial GuineaEritreaEstoniaEthiopiaEuro areaEurope & Central AsiaEurope & Central Asia (excluding high income)Europe & Central Asia (IDA & IBRD countries)European UnionFaroe IslandsFijiFinlandFragile and conflict affected situationsFranceFrench PolynesiaGabonGambia, TheGeorgiaGermanyGhanaGreeceGrenadaGuatemalaGuineaGuinea-BissauGuyanaHaitiHeavily indebted poor countries (HIPC)High incomeHondurasHong Kong SAR, ChinaHungaryIBRD onlyIcelandIDA & IBRD totalIDA blendIDA onlyIDA totalIndiaIndonesiaIran, Islamic Rep.IraqIrelandIsraelItalyJamaicaJapanJordanKazakhstanKenyaKiribatiKorea, Rep.KosovoKuwaitKyrgyz RepublicLao PDRLate-demographic dividendLatin America & Caribbean Latin America & Caribbean (excluding high income)Latin America & the Caribbean (IDA & IBRD countries)LatviaLeast developed countries: UN classificationLebanonLesothoLiberiaLibyaLithuaniaLow & middle incomeLow incomeLower middle incomeLuxembourgMacao SAR, ChinaMacedonia, FYRMadagascarMalawiMalaysiaMaldivesMaliMaltaMarshall IslandsMauritaniaMauritiusMexicoMicronesia, Fed. Sts.Middle East & North Africa (excluding high income)Middle East & North Africa (IDA & IBRD countries)Middle incomeMoldovaMongoliaMontenegroMoroccoMozambiqueMyanmarNamibiaNepalNetherlandsNew CaledoniaNew ZealandNicaraguaNigerNigeriaNorth AmericaNorwayOECD membersOmanPacific island small statesPakistanPalauPanamaPapua New GuineaParaguayPeruPhilippinesPolandPortugalPost-demographic dividendPre-demographic dividendQatarRomaniaRussian FederationRwandaSamoaSao Tome and PrincipeSaudi ArabiaSenegalSerbiaSeychellesSierra LeoneSingaporeSint Maarten (Dutch part)Slovak RepublicSloveniaSolomon IslandsSouth AfricaSouth AsiaSouth Asia (IDA & IBRD)South SudanSpainSri LankaSt. Kitts and NevisSt. LuciaSt. Vincent and the GrenadinesSub-Saharan Africa Sub-Saharan Africa (excluding high income)Sub-Saharan Africa (IDA & IBRD countries)SudanSurinameSwazilandSwedenSwitzerlandSyrian Arab RepublicTajikistanTanzaniaThailandTimor-LesteTogoTongaTrinidad and TobagoTunisiaTurkeyTuvaluUgandaUkraineUnited KingdomUnited StatesUpper middle incomeUruguayVanuatuVenezuela, RBVietnamWest Bank and GazaWorldYemen, Rep.ZambiaZimbabwe Timeline:
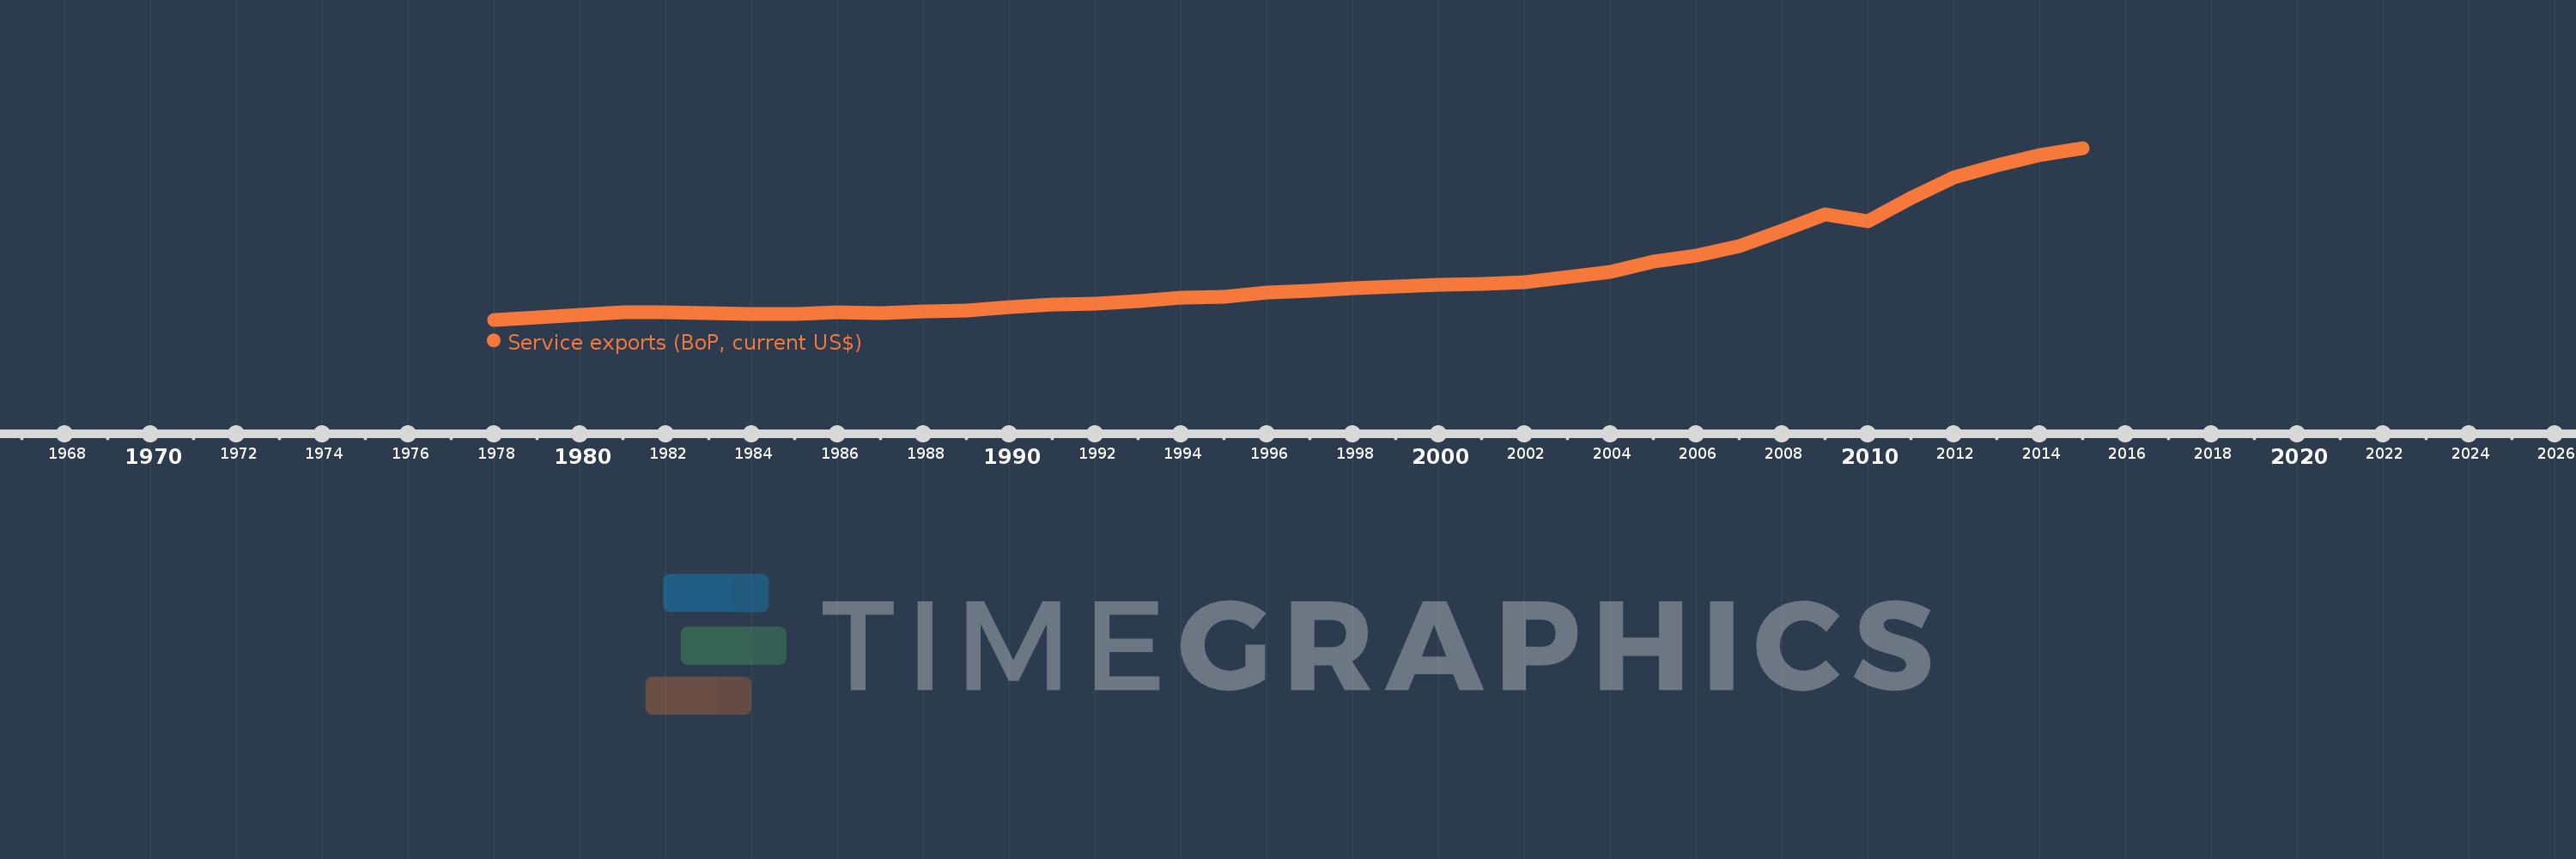
This timeline shows a graph from 1978 to 2015 of IDA total. No data until 1977. Number of actual observations by date: 38.
Source name:
World Development Indicators
Source organization:
International Monetary Fund, Balance of Payments Statistics Yearbook and data files.
Categories, topics:
Economy & Growth, Trade
Last updated:
apr 23, 2017
Indicators value changes by year
Minimum:
4.827 bln
jan 1, 1978
Maximum:
104.303 bln
jan 1, 2015
At the date of observation
Value
Absolute change
Change from previous value
jan 1, 1978
4.827 bln
+4.827 bln
0.0%
jan 1, 1979
6.015 bln
+1.189 bln
24.63%
jan 1, 1980
7.453 bln
+1.438 bln
23.9%
jan 1, 1981
8.947 bln
+1.494 bln
20.05%
jan 1, 1982
9.169 bln
+221.711 mln
2.48%
jan 1, 1983
8.774 bln
-395.012 mln
-4.31%
jan 1, 1984
8.225 bln
-549.179 mln
-6.26%
jan 1, 1985
8.145 bln
-79.683 mln
-0.97%
jan 1, 1986
9.051 bln
+906.42 mln
11.13%
jan 1, 1987
8.826 bln
-225.35 mln
-2.49%
jan 1, 1988
9.737 bln
+910.922 mln
10.32%
jan 1, 1989
10.293 bln
+556.079 mln
5.71%
jan 1, 1990
11.898 bln
+1.605 bln
15.59%
jan 1, 1991
13.756 bln
+1.859 bln
15.62%
jan 1, 1992
14.06 bln
+303.888 mln
2.21%
jan 1, 1993
15.533 bln
+1.473 bln
10.47%
jan 1, 1994
17.391 bln
+1.858 bln
11.96%
jan 1, 1995
18.147 bln
+756.236 mln
4.35%
jan 1, 1996
20.577 bln
+2.43 bln
13.39%
jan 1, 1997
21.517 bln
+940.324 mln
4.57%
jan 1, 1998
23.034 bln
+1.517 bln
7.05%
jan 1, 1999
24.051 bln
+1.016 bln
4.41%
jan 1, 2000
25.076 bln
+1.025 bln
4.26%
jan 1, 2001
25.472 bln
+395.523 mln
1.58%
jan 1, 2002
26.622 bln
+1.15 bln
4.52%
jan 1, 2003
29.542 bln
+2.92 bln
10.97%
jan 1, 2004
32.622 bln
+3.08 bln
10.43%
jan 1, 2005
38.399 bln
+5.777 bln
17.71%
jan 1, 2006
41.841 bln
+3.442 bln
8.96%
jan 1, 2007
47.326 bln
+5.485 bln
13.11%
jan 1, 2008
56.222 bln
+8.896 bln
18.8%
jan 1, 2009
65.827 bln
+9.605 bln
17.08%
jan 1, 2010
61.684 bln
-4.143 bln
-6.29%
jan 1, 2011
75.221 bln
+13.537 bln
21.95%
jan 1, 2012
86.999 bln
+11.778 bln
15.66%
jan 1, 2013
94.333 bln
+7.334 bln
8.43%
jan 1, 2014
99.98 bln
+5.647 bln
5.99%
jan 1, 2015
104.303 bln
+4.323 bln
4.32%
Ranking of countries by current statistics by years


Comments: