29
/
en
AIzaSyAYiBZKx7MnpbEhh9jyipgxe19OcubqV5w
April 1, 2024
161967
Italy
ITA
true
2
1
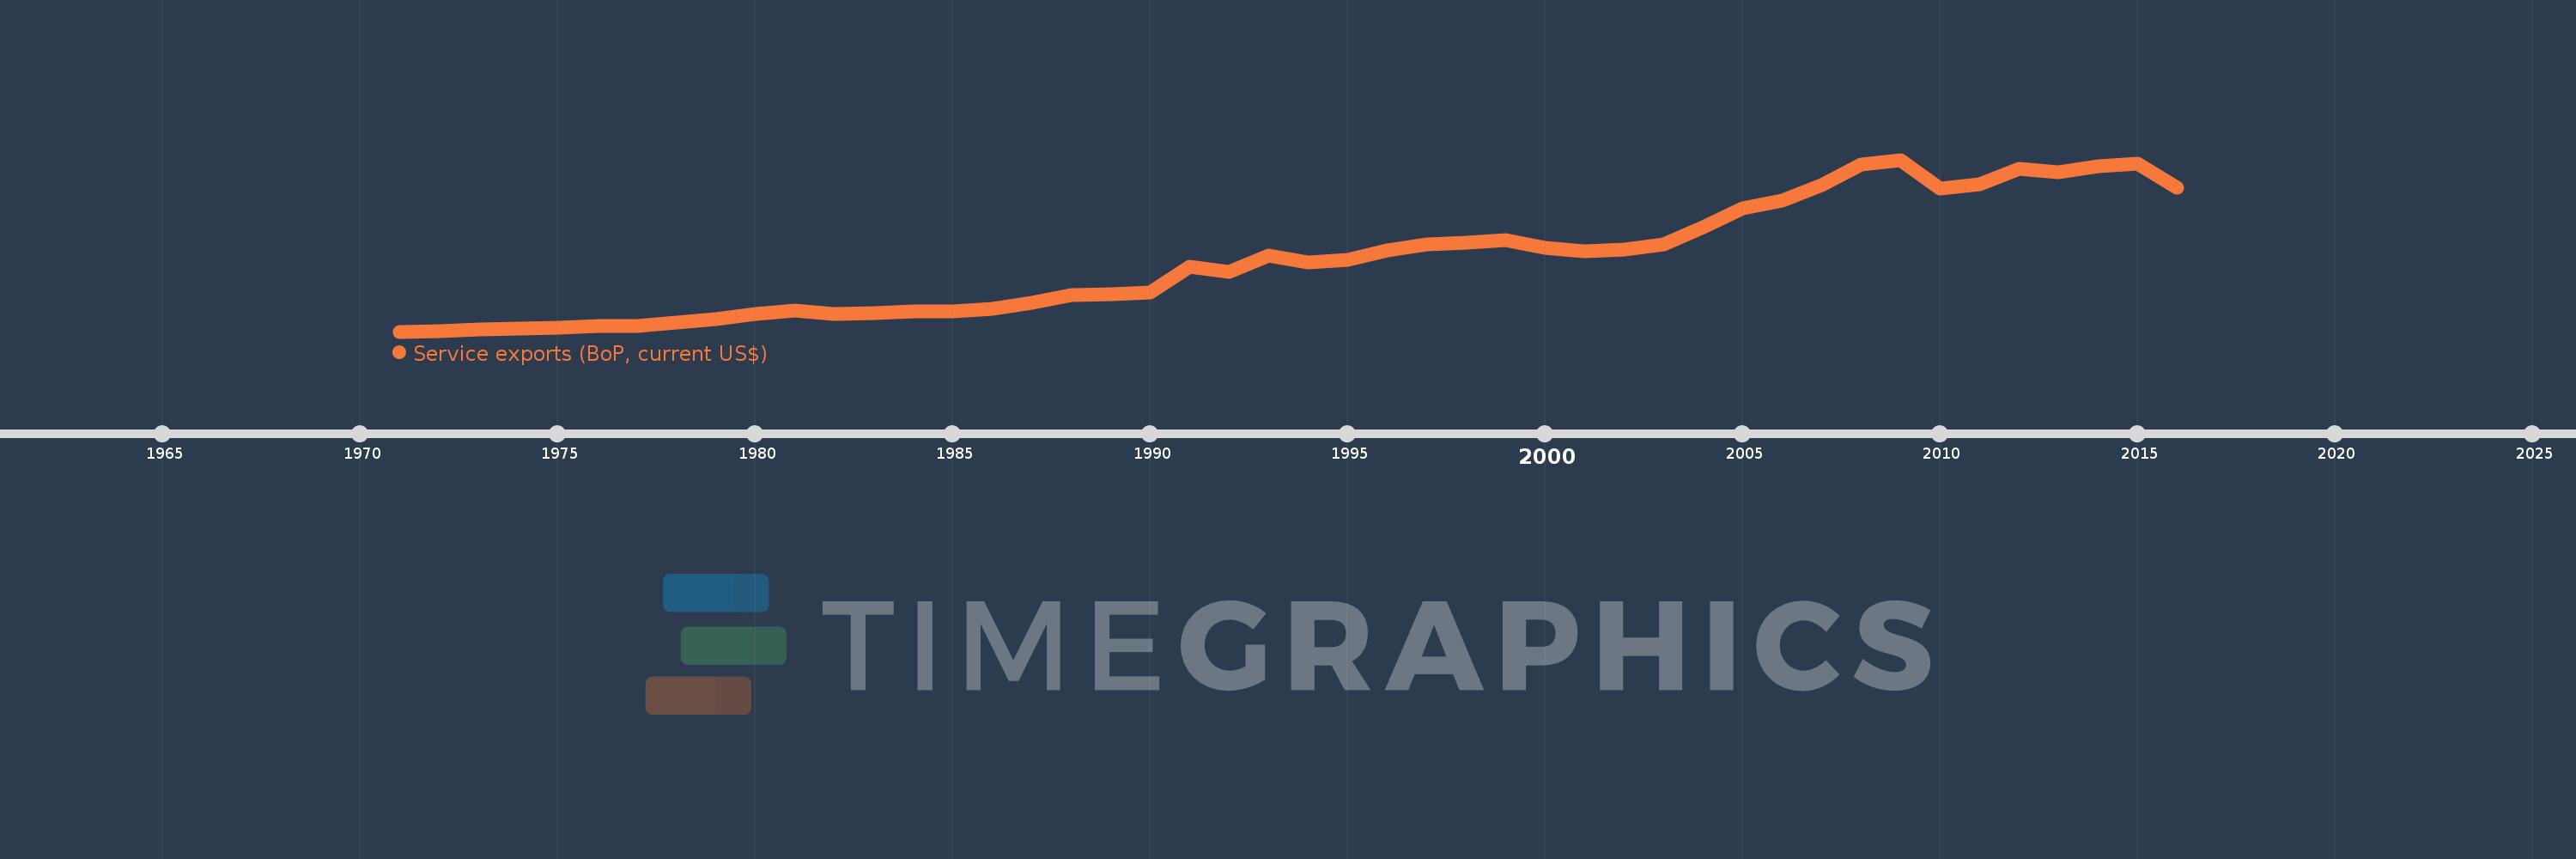
Service exports (BoP, current US$)
2016,2015,2014,2013,2012,2011,2010,2009,2008,2007,2006,2005,2004,2003,2002,2001,2000,1999,1998,1997,1996,1995,1994,1993,1992,1991,1990,1989,1988,1987,1986,1985,1984,1983,1982,1981,1980,1979,1978,1977,1976,1975,1974,1973,1972,1971
This statistics in other country:
AfghanistanAlbaniaAlgeriaAngolaAntigua and BarbudaArab WorldArgentinaArmeniaArubaAustraliaAustriaAzerbaijanBahamas, TheBahrainBangladeshBarbadosBelarusBelgiumBelizeBeninBermudaBhutanBoliviaBosnia and HerzegovinaBotswanaBrazilBrunei DarussalamBulgariaBurkina FasoBurundiCabo VerdeCambodiaCameroonCanadaCaribbean small statesCentral African RepublicCentral Europe and the BalticsChadChileChinaColombiaComorosCongo, Dem. Rep.Congo, Rep.Costa RicaCote d'IvoireCroatiaCuracaoCyprusCzech RepublicDenmarkDjiboutiDominicaDominican RepublicEarly-demographic dividendEast Asia & PacificEast Asia & Pacific (excluding high income)East Asia & Pacific (IDA & IBRD countries)EcuadorEgypt, Arab Rep.El SalvadorEquatorial GuineaEritreaEstoniaEthiopiaEuro areaEurope & Central AsiaEurope & Central Asia (excluding high income)Europe & Central Asia (IDA & IBRD countries)European UnionFaroe IslandsFijiFinlandFragile and conflict affected situationsFranceFrench PolynesiaGabonGambia, TheGeorgiaGermanyGhanaGreeceGrenadaGuatemalaGuineaGuinea-BissauGuyanaHaitiHeavily indebted poor countries (HIPC)High incomeHondurasHong Kong SAR, ChinaHungaryIBRD onlyIcelandIDA & IBRD totalIDA blendIDA onlyIDA totalIndiaIndonesiaIran, Islamic Rep.IraqIrelandIsraelItalyJamaicaJapanJordanKazakhstanKenyaKiribatiKorea, Rep.KosovoKuwaitKyrgyz RepublicLao PDRLate-demographic dividendLatin America & Caribbean Latin America & Caribbean (excluding high income)Latin America & the Caribbean (IDA & IBRD countries)LatviaLeast developed countries: UN classificationLebanonLesothoLiberiaLibyaLithuaniaLow & middle incomeLow incomeLower middle incomeLuxembourgMacao SAR, ChinaMacedonia, FYRMadagascarMalawiMalaysiaMaldivesMaliMaltaMarshall IslandsMauritaniaMauritiusMexicoMicronesia, Fed. Sts.Middle East & North Africa (excluding high income)Middle East & North Africa (IDA & IBRD countries)Middle incomeMoldovaMongoliaMontenegroMoroccoMozambiqueMyanmarNamibiaNepalNetherlandsNew CaledoniaNew ZealandNicaraguaNigerNigeriaNorth AmericaNorwayOECD membersOmanPacific island small statesPakistanPalauPanamaPapua New GuineaParaguayPeruPhilippinesPolandPortugalPost-demographic dividendPre-demographic dividendQatarRomaniaRussian FederationRwandaSamoaSao Tome and PrincipeSaudi ArabiaSenegalSerbiaSeychellesSierra LeoneSingaporeSint Maarten (Dutch part)Slovak RepublicSloveniaSolomon IslandsSouth AfricaSouth AsiaSouth Asia (IDA & IBRD)South SudanSpainSri LankaSt. Kitts and NevisSt. LuciaSt. Vincent and the GrenadinesSub-Saharan Africa Sub-Saharan Africa (excluding high income)Sub-Saharan Africa (IDA & IBRD countries)SudanSurinameSwazilandSwedenSwitzerlandSyrian Arab RepublicTajikistanTanzaniaThailandTimor-LesteTogoTongaTrinidad and TobagoTunisiaTurkeyTuvaluUgandaUkraineUnited KingdomUnited StatesUpper middle incomeUruguayVanuatuVenezuela, RBVietnamWest Bank and GazaWorldYemen, Rep.ZambiaZimbabwe Timeline:
This timeline shows a graph from 1971 to 2016 of Italy. No data until 1970. Number of actual observations by date: 46.
Source name:
World Development Indicators
Source organization:
International Monetary Fund, Balance of Payments Statistics Yearbook and data files.
Categories, topics:
Economy & Growth, Trade
Last updated:
apr 23, 2017
Indicators value changes by year
Minimum:
3.851 bln
jan 1, 1971
Maximum:
116.479 bln
jan 1, 2009
At the date of observation
Value
Absolute change
Change from previous value
jan 1, 1971
3.851 bln
+3.851 bln
0.0%
jan 1, 1972
4.217 bln
+366.206 mln
9.51%
jan 1, 1973
4.984 bln
+767.085 mln
18.19%
jan 1, 1974
5.747 bln
+762.091 mln
15.29%
jan 1, 1975
6.15 bln
+403.635 mln
7.02%
jan 1, 1976
7.375 bln
+1.225 bln
19.92%
jan 1, 1977
7.298 bln
-77.175 mln
-1.05%
jan 1, 1978
9.674 bln
+2.376 bln
32.55%
jan 1, 1979
12.148 bln
+2.475 bln
25.58%
jan 1, 1980
15.587 bln
+3.439 bln
28.31%
jan 1, 1981
17.709 bln
+2.122 bln
13.61%
jan 1, 1982
15.412 bln
-2.297 bln
-12.97%
jan 1, 1983
16.204 bln
+792.513 mln
5.14%
jan 1, 1984
16.908 bln
+703.716 mln
4.34%
jan 1, 1985
17.034 bln
+126.055 mln
0.75%
jan 1, 1986
18.634 bln
+1.6 bln
9.39%
jan 1, 1987
22.656 bln
+4.023 bln
21.59%
jan 1, 1988
28.049 bln
+5.393 bln
23.8%
jan 1, 1989
28.16 bln
+110.729 mln
0.39%
jan 1, 1990
29.577 bln
+1.417 bln
5.03%
jan 1, 1991
46.233 bln
+16.656 bln
56.32%
jan 1, 1992
42.783 bln
-3.45 bln
-7.46%
jan 1, 1993
53.922 bln
+11.139 bln
26.04%
jan 1, 1994
48.924 bln
-4.998 bln
-9.27%
jan 1, 1995
51.014 bln
+2.09 bln
4.27%
jan 1, 1996
56.927 bln
+5.914 bln
11.59%
jan 1, 1997
60.816 bln
+3.888 bln
6.83%
jan 1, 1998
61.976 bln
+1.16 bln
1.91%
jan 1, 1999
63.79 bln
+1.814 bln
2.93%
jan 1, 2000
58.965 bln
-4.825 bln
-7.56%
jan 1, 2001
56.703 bln
-2.261 bln
-3.83%
jan 1, 2002
57.581 bln
+877.5 mln
1.55%
jan 1, 2003
60.926 bln
+3.346 bln
5.81%
jan 1, 2004
72.112 bln
+11.186 bln
18.36%
jan 1, 2005
84.44 bln
+12.328 bln
17.1%
jan 1, 2006
89.7 bln
+5.261 bln
6.23%
jan 1, 2007
99.991 bln
+10.29 bln
11.47%
jan 1, 2008
113.134 bln
+13.143 bln
13.14%
jan 1, 2009
116.479 bln
+3.345 bln
2.96%
jan 1, 2010
97.336 bln
-19.143 bln
-16.43%
jan 1, 2011
100.678 bln
+3.342 bln
3.43%
jan 1, 2012
110.587 bln
+9.909 bln
9.84%
jan 1, 2013
108.392 bln
-2.195 bln
-1.98%
jan 1, 2014
111.994 bln
+3.602 bln
3.32%
jan 1, 2015
113.985 bln
+1.991 bln
1.78%
jan 1, 2016
98.169 bln
-15.816 bln
-13.88%
Ranking of countries by current statistics by years


Comments: