29
/
en
AIzaSyAYiBZKx7MnpbEhh9jyipgxe19OcubqV5w
April 1, 2024
258975
Syrian Arab Republic
SYR
true
2
1
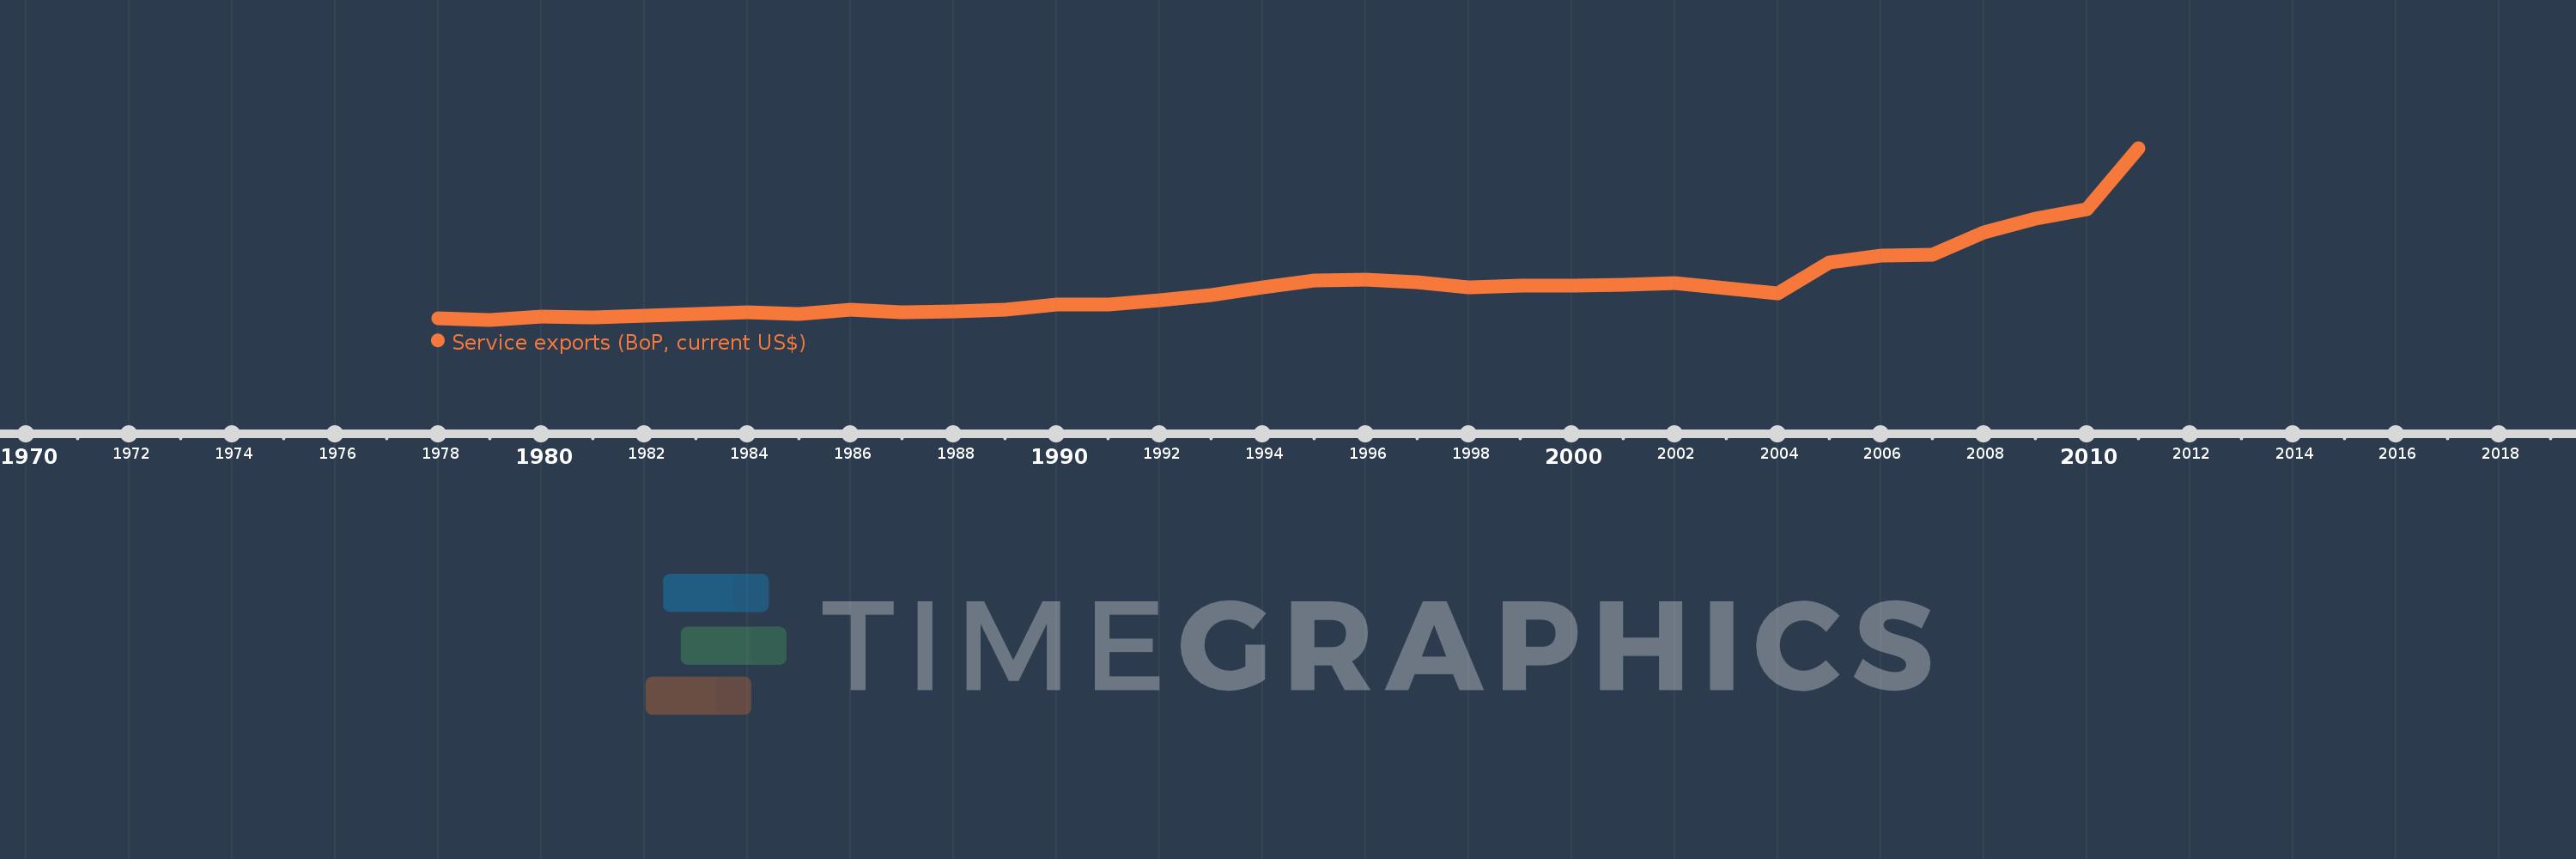
Service exports (BoP, current US$)
2011,2010,2009,2008,2007,2006,2005,2004,2003,2002,2001,2000,1999,1998,1997,1996,1995,1994,1993,1992,1991,1990,1989,1988,1987,1986,1985,1984,1983,1982,1981,1980,1979,1978
This statistics in other country:
AfghanistanAlbaniaAlgeriaAngolaAntigua and BarbudaArab WorldArgentinaArmeniaArubaAustraliaAustriaAzerbaijanBahamas, TheBahrainBangladeshBarbadosBelarusBelgiumBelizeBeninBermudaBhutanBoliviaBosnia and HerzegovinaBotswanaBrazilBrunei DarussalamBulgariaBurkina FasoBurundiCabo VerdeCambodiaCameroonCanadaCaribbean small statesCentral African RepublicCentral Europe and the BalticsChadChileChinaColombiaComorosCongo, Dem. Rep.Congo, Rep.Costa RicaCote d'IvoireCroatiaCuracaoCyprusCzech RepublicDenmarkDjiboutiDominicaDominican RepublicEarly-demographic dividendEast Asia & PacificEast Asia & Pacific (excluding high income)East Asia & Pacific (IDA & IBRD countries)EcuadorEgypt, Arab Rep.El SalvadorEquatorial GuineaEritreaEstoniaEthiopiaEuro areaEurope & Central AsiaEurope & Central Asia (excluding high income)Europe & Central Asia (IDA & IBRD countries)European UnionFaroe IslandsFijiFinlandFragile and conflict affected situationsFranceFrench PolynesiaGabonGambia, TheGeorgiaGermanyGhanaGreeceGrenadaGuatemalaGuineaGuinea-BissauGuyanaHaitiHeavily indebted poor countries (HIPC)High incomeHondurasHong Kong SAR, ChinaHungaryIBRD onlyIcelandIDA & IBRD totalIDA blendIDA onlyIDA totalIndiaIndonesiaIran, Islamic Rep.IraqIrelandIsraelItalyJamaicaJapanJordanKazakhstanKenyaKiribatiKorea, Rep.KosovoKuwaitKyrgyz RepublicLao PDRLate-demographic dividendLatin America & Caribbean Latin America & Caribbean (excluding high income)Latin America & the Caribbean (IDA & IBRD countries)LatviaLeast developed countries: UN classificationLebanonLesothoLiberiaLibyaLithuaniaLow & middle incomeLow incomeLower middle incomeLuxembourgMacao SAR, ChinaMacedonia, FYRMadagascarMalawiMalaysiaMaldivesMaliMaltaMarshall IslandsMauritaniaMauritiusMexicoMicronesia, Fed. Sts.Middle East & North Africa (excluding high income)Middle East & North Africa (IDA & IBRD countries)Middle incomeMoldovaMongoliaMontenegroMoroccoMozambiqueMyanmarNamibiaNepalNetherlandsNew CaledoniaNew ZealandNicaraguaNigerNigeriaNorth AmericaNorwayOECD membersOmanPacific island small statesPakistanPalauPanamaPapua New GuineaParaguayPeruPhilippinesPolandPortugalPost-demographic dividendPre-demographic dividendQatarRomaniaRussian FederationRwandaSamoaSao Tome and PrincipeSaudi ArabiaSenegalSerbiaSeychellesSierra LeoneSingaporeSint Maarten (Dutch part)Slovak RepublicSloveniaSolomon IslandsSouth AfricaSouth AsiaSouth Asia (IDA & IBRD)South SudanSpainSri LankaSt. Kitts and NevisSt. LuciaSt. Vincent and the GrenadinesSub-Saharan Africa Sub-Saharan Africa (excluding high income)Sub-Saharan Africa (IDA & IBRD countries)SudanSurinameSwazilandSwedenSwitzerlandSyrian Arab RepublicTajikistanTanzaniaThailandTimor-LesteTogoTongaTrinidad and TobagoTunisiaTurkeyTuvaluUgandaUkraineUnited KingdomUnited StatesUpper middle incomeUruguayVanuatuVenezuela, RBVietnamWest Bank and GazaWorldYemen, Rep.ZambiaZimbabwe Timeline:
This timeline shows a graph from 1978 to 2011 of Syrian Arab Republic. No data until 1977. Number of actual observations by date: 34.
Source name:
World Development Indicators
Source organization:
International Monetary Fund, Balance of Payments Statistics Yearbook and data files.
Categories, topics:
Economy & Growth, Trade
Last updated:
apr 23, 2017
Indicators value changes by year
Minimum:
259.2 mln
jan 1, 1979
Maximum:
7.333 bln
jan 1, 2011
At the date of observation
Value
Absolute change
Change from previous value
jan 1, 1978
329.5 mln
+329.5 mln
0.0%
jan 1, 1979
259.2 mln
-70.3 mln
-21.34%
jan 1, 1980
376.3 mln
+117.1 mln
45.18%
jan 1, 1981
364.8 mln
-11.5 mln
-3.06%
jan 1, 1982
431.3 mln
+66.5 mln
18.23%
jan 1, 1983
483.0 mln
+51.7 mln
11.99%
jan 1, 1984
559.5 mln
+76.5 mln
15.84%
jan 1, 1985
512.0 mln
-47.5 mln
-8.49%
jan 1, 1986
655.6 mln
+143.6 mln
28.05%
jan 1, 1987
566.2 mln
-89.4 mln
-13.64%
jan 1, 1988
600.0 mln
+33.8 mln
5.97%
jan 1, 1989
667.0 mln
+67.0 mln
11.17%
jan 1, 1990
893.4 mln
+226.4 mln
33.94%
jan 1, 1991
873.6 mln
-19.8 mln
-2.22%
jan 1, 1992
1.065 bln
+191.0 mln
21.86%
jan 1, 1993
1.281 bln
+216.0 mln
20.29%
jan 1, 1994
1.595 bln
+314.4 mln
24.55%
jan 1, 1995
1.863 bln
+268.0 mln
16.8%
jan 1, 1996
1.899 bln
+36.0 mln
1.93%
jan 1, 1997
1.792 bln
-107.0 mln
-5.63%
jan 1, 1998
1.582 bln
-210.0 mln
-11.72%
jan 1, 1999
1.666 bln
+84.0 mln
5.31%
jan 1, 2000
1.651 bln
-15.0 mln
-0.9%
jan 1, 2001
1.699 bln
+48.0 mln
2.91%
jan 1, 2002
1.781 bln
+82.0 mln
4.83%
jan 1, 2003
1.559 bln
-222.0 mln
-12.46%
jan 1, 2004
1.353 bln
-206.0 mln
-13.21%
jan 1, 2005
2.613 bln
+1.26 bln
93.13%
jan 1, 2006
2.91 bln
+296.9 mln
11.36%
jan 1, 2007
2.924 bln
+14.0 mln
0.48%
jan 1, 2008
3.861 bln
+937.348 mln
32.06%
jan 1, 2009
4.415 bln
+553.967 mln
14.35%
jan 1, 2010
4.798 bln
+383.101 mln
8.68%
jan 1, 2011
7.333 bln
+2.535 bln
52.82%
Ranking of countries by current statistics by years


Comments: