29
/
en
AIzaSyAYiBZKx7MnpbEhh9jyipgxe19OcubqV5w
April 1, 2024
211086
Nicaragua
NIC
true
2
1
Service exports (BoP, current US$)
2016,2015,2014,2013,2012,2011,2010,2009,2008,2007,2006,2005,2004,2003,2002,2001,2000,1999,1998,1997,1996,1995,1994,1993,1992,1991,1990,1989,1988,1987,1986,1985,1984,1983,1982,1981,1980,1979,1978
This statistics in other country:
AfghanistanAlbaniaAlgeriaAngolaAntigua and BarbudaArab WorldArgentinaArmeniaArubaAustraliaAustriaAzerbaijanBahamas, TheBahrainBangladeshBarbadosBelarusBelgiumBelizeBeninBermudaBhutanBoliviaBosnia and HerzegovinaBotswanaBrazilBrunei DarussalamBulgariaBurkina FasoBurundiCabo VerdeCambodiaCameroonCanadaCaribbean small statesCentral African RepublicCentral Europe and the BalticsChadChileChinaColombiaComorosCongo, Dem. Rep.Congo, Rep.Costa RicaCote d'IvoireCroatiaCuracaoCyprusCzech RepublicDenmarkDjiboutiDominicaDominican RepublicEarly-demographic dividendEast Asia & PacificEast Asia & Pacific (excluding high income)East Asia & Pacific (IDA & IBRD countries)EcuadorEgypt, Arab Rep.El SalvadorEquatorial GuineaEritreaEstoniaEthiopiaEuro areaEurope & Central AsiaEurope & Central Asia (excluding high income)Europe & Central Asia (IDA & IBRD countries)European UnionFaroe IslandsFijiFinlandFragile and conflict affected situationsFranceFrench PolynesiaGabonGambia, TheGeorgiaGermanyGhanaGreeceGrenadaGuatemalaGuineaGuinea-BissauGuyanaHaitiHeavily indebted poor countries (HIPC)High incomeHondurasHong Kong SAR, ChinaHungaryIBRD onlyIcelandIDA & IBRD totalIDA blendIDA onlyIDA totalIndiaIndonesiaIran, Islamic Rep.IraqIrelandIsraelItalyJamaicaJapanJordanKazakhstanKenyaKiribatiKorea, Rep.KosovoKuwaitKyrgyz RepublicLao PDRLate-demographic dividendLatin America & Caribbean Latin America & Caribbean (excluding high income)Latin America & the Caribbean (IDA & IBRD countries)LatviaLeast developed countries: UN classificationLebanonLesothoLiberiaLibyaLithuaniaLow & middle incomeLow incomeLower middle incomeLuxembourgMacao SAR, ChinaMacedonia, FYRMadagascarMalawiMalaysiaMaldivesMaliMaltaMarshall IslandsMauritaniaMauritiusMexicoMicronesia, Fed. Sts.Middle East & North Africa (excluding high income)Middle East & North Africa (IDA & IBRD countries)Middle incomeMoldovaMongoliaMontenegroMoroccoMozambiqueMyanmarNamibiaNepalNetherlandsNew CaledoniaNew ZealandNicaraguaNigerNigeriaNorth AmericaNorwayOECD membersOmanPacific island small statesPakistanPalauPanamaPapua New GuineaParaguayPeruPhilippinesPolandPortugalPost-demographic dividendPre-demographic dividendQatarRomaniaRussian FederationRwandaSamoaSao Tome and PrincipeSaudi ArabiaSenegalSerbiaSeychellesSierra LeoneSingaporeSint Maarten (Dutch part)Slovak RepublicSloveniaSolomon IslandsSouth AfricaSouth AsiaSouth Asia (IDA & IBRD)South SudanSpainSri LankaSt. Kitts and NevisSt. LuciaSt. Vincent and the GrenadinesSub-Saharan Africa Sub-Saharan Africa (excluding high income)Sub-Saharan Africa (IDA & IBRD countries)SudanSurinameSwazilandSwedenSwitzerlandSyrian Arab RepublicTajikistanTanzaniaThailandTimor-LesteTogoTongaTrinidad and TobagoTunisiaTurkeyTuvaluUgandaUkraineUnited KingdomUnited StatesUpper middle incomeUruguayVanuatuVenezuela, RBVietnamWest Bank and GazaWorldYemen, Rep.ZambiaZimbabwe Timeline:
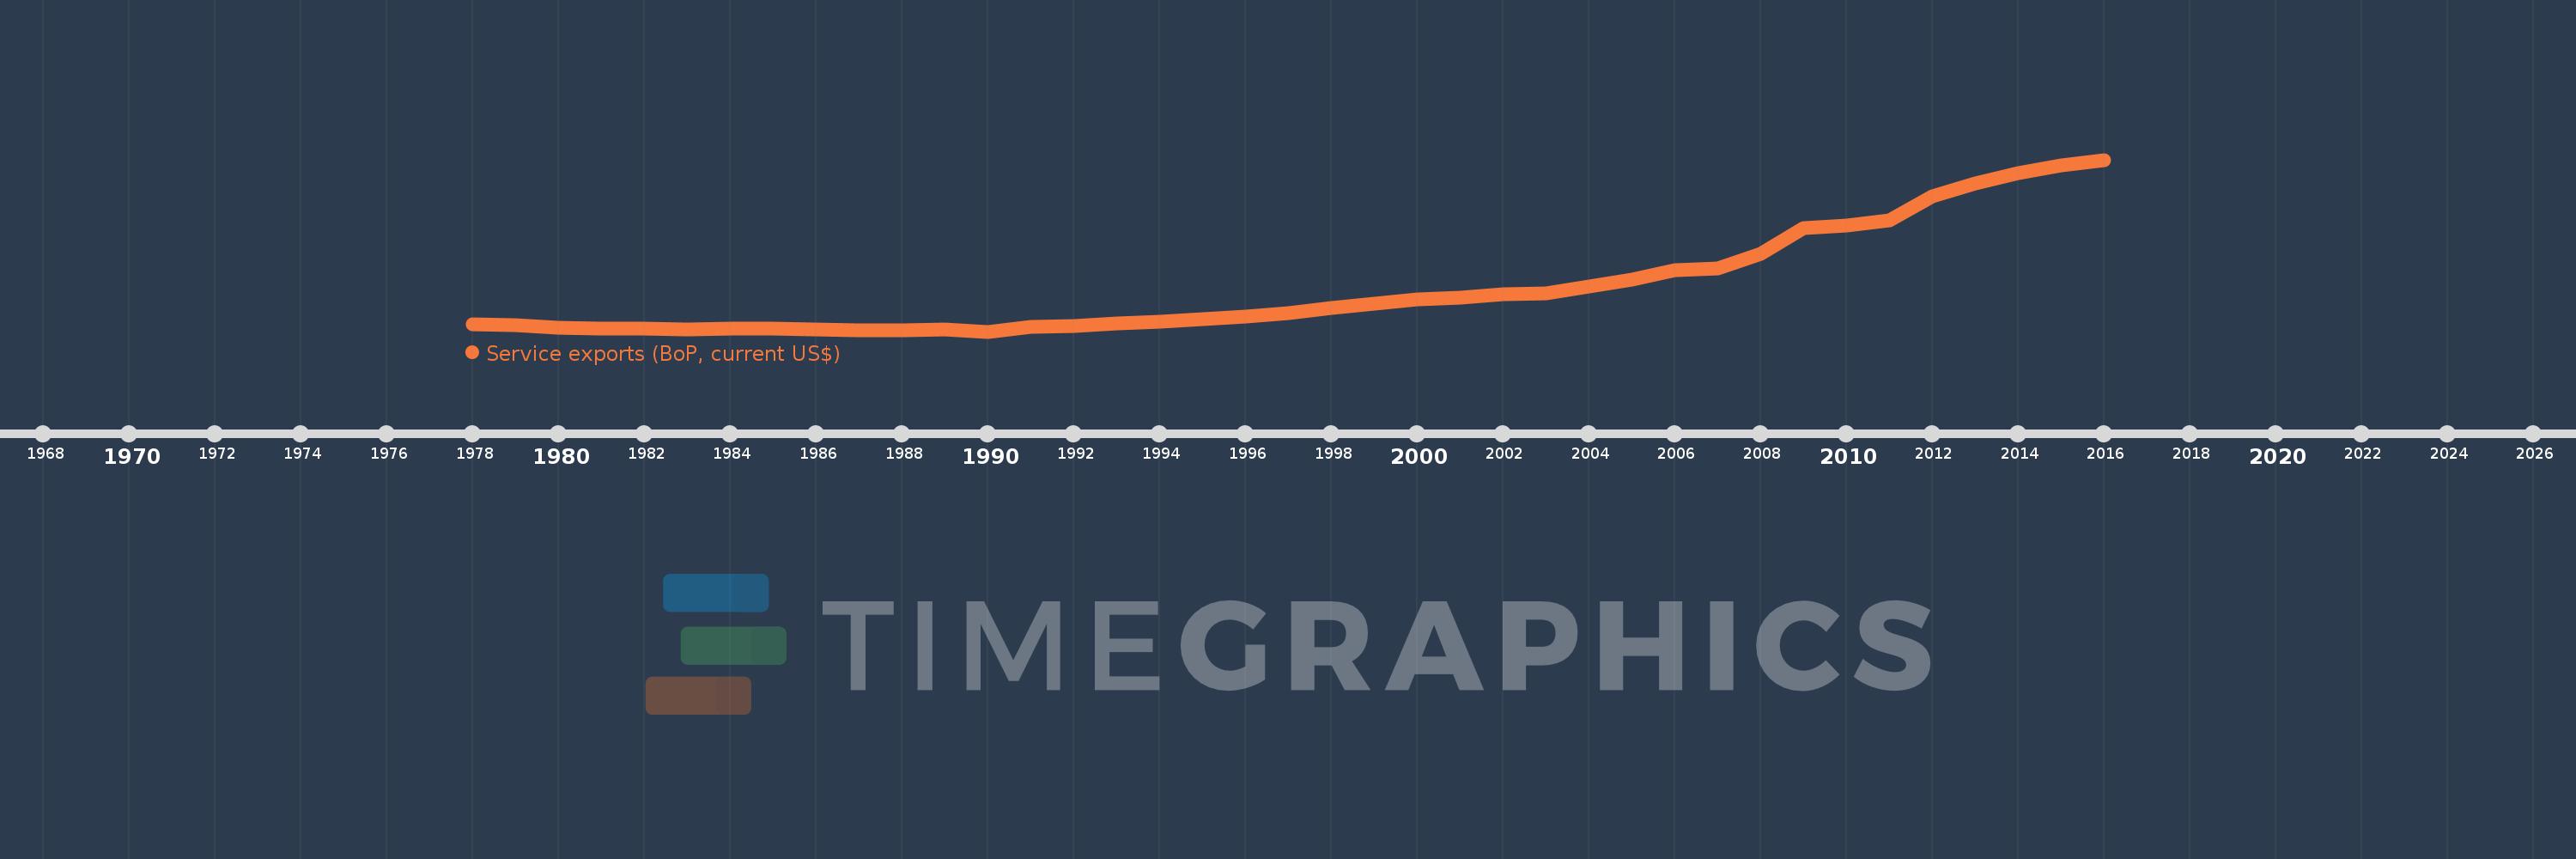
This timeline shows a graph from 1978 to 2016 of Nicaragua. No data until 1977. Number of actual observations by date: 39.
Source name:
World Development Indicators
Source organization:
International Monetary Fund, Balance of Payments Statistics Yearbook and data files.
Categories, topics:
Economy & Growth, Trade
Last updated:
apr 23, 2017
Indicators value changes by year
Minimum:
22.0 mln
jan 1, 1990
Maximum:
1.437 bln
jan 1, 2016
At the date of observation
Value
Absolute change
Change from previous value
jan 1, 1978
83.1 mln
+83.1 mln
0.0%
jan 1, 1979
74.2 mln
-8.9 mln
-10.71%
jan 1, 1980
56.3 mln
-17.9 mln
-24.12%
jan 1, 1981
44.4 mln
-11.9 mln
-21.14%
jan 1, 1982
45.1 mln
+700.0K
1.58%
jan 1, 1983
40.8 mln
-4.3 mln
-9.53%
jan 1, 1984
46.1 mln
+5.3 mln
12.99%
jan 1, 1985
48.4 mln
+2.3 mln
4.99%
jan 1, 1986
39.3 mln
-9.1 mln
-18.8%
jan 1, 1987
29.5 mln
-9.8 mln
-24.94%
jan 1, 1988
29.5 mln
0.0
0.0%
jan 1, 1989
37.4 mln
+7.9 mln
26.78%
jan 1, 1990
22.0 mln
-15.4 mln
-41.18%
jan 1, 1991
59.8 mln
+37.8 mln
171.82%
jan 1, 1992
70.2 mln
+10.4 mln
17.39%
jan 1, 1993
86.2 mln
+16.0 mln
22.79%
jan 1, 1994
100.2 mln
+14.0 mln
16.24%
jan 1, 1995
126.092 mln
+25.892 mln
25.84%
jan 1, 1996
143.721 mln
+17.629 mln
13.98%
jan 1, 1997
174.828 mln
+31.107 mln
21.64%
jan 1, 1998
217.434 mln
+42.606 mln
24.37%
jan 1, 1999
252.664 mln
+35.23 mln
16.2%
jan 1, 2000
288.822 mln
+36.158 mln
14.31%
jan 1, 2001
303.7 mln
+14.878 mln
5.15%
jan 1, 2002
331.6 mln
+27.9 mln
9.19%
jan 1, 2003
337.0 mln
+5.4 mln
1.63%
jan 1, 2004
390.4 mln
+53.4 mln
15.85%
jan 1, 2005
452.8 mln
+62.4 mln
15.98%
jan 1, 2006
530.7 mln
+77.9 mln
17.2%
jan 1, 2007
538.7 mln
+8.0 mln
1.51%
jan 1, 2008
665.6 mln
+126.9 mln
23.56%
jan 1, 2009
877.9 mln
+212.3 mln
31.9%
jan 1, 2010
894.0 mln
+16.1 mln
1.83%
jan 1, 2011
935.3 mln
+41.3 mln
4.62%
jan 1, 2012
1.133 bln
+198.2 mln
21.19%
jan 1, 2013
1.244 bln
+110.6 mln
9.76%
jan 1, 2014
1.325 bln
+80.9 mln
6.5%
jan 1, 2015
1.388 bln
+63.4 mln
4.78%
jan 1, 2016
1.437 bln
+48.7 mln
3.51%
Ranking of countries by current statistics by years


Comments: