29
/
en
AIzaSyAYiBZKx7MnpbEhh9jyipgxe19OcubqV5w
April 1, 2024
268700
Tunisia
TUN
true
2
1
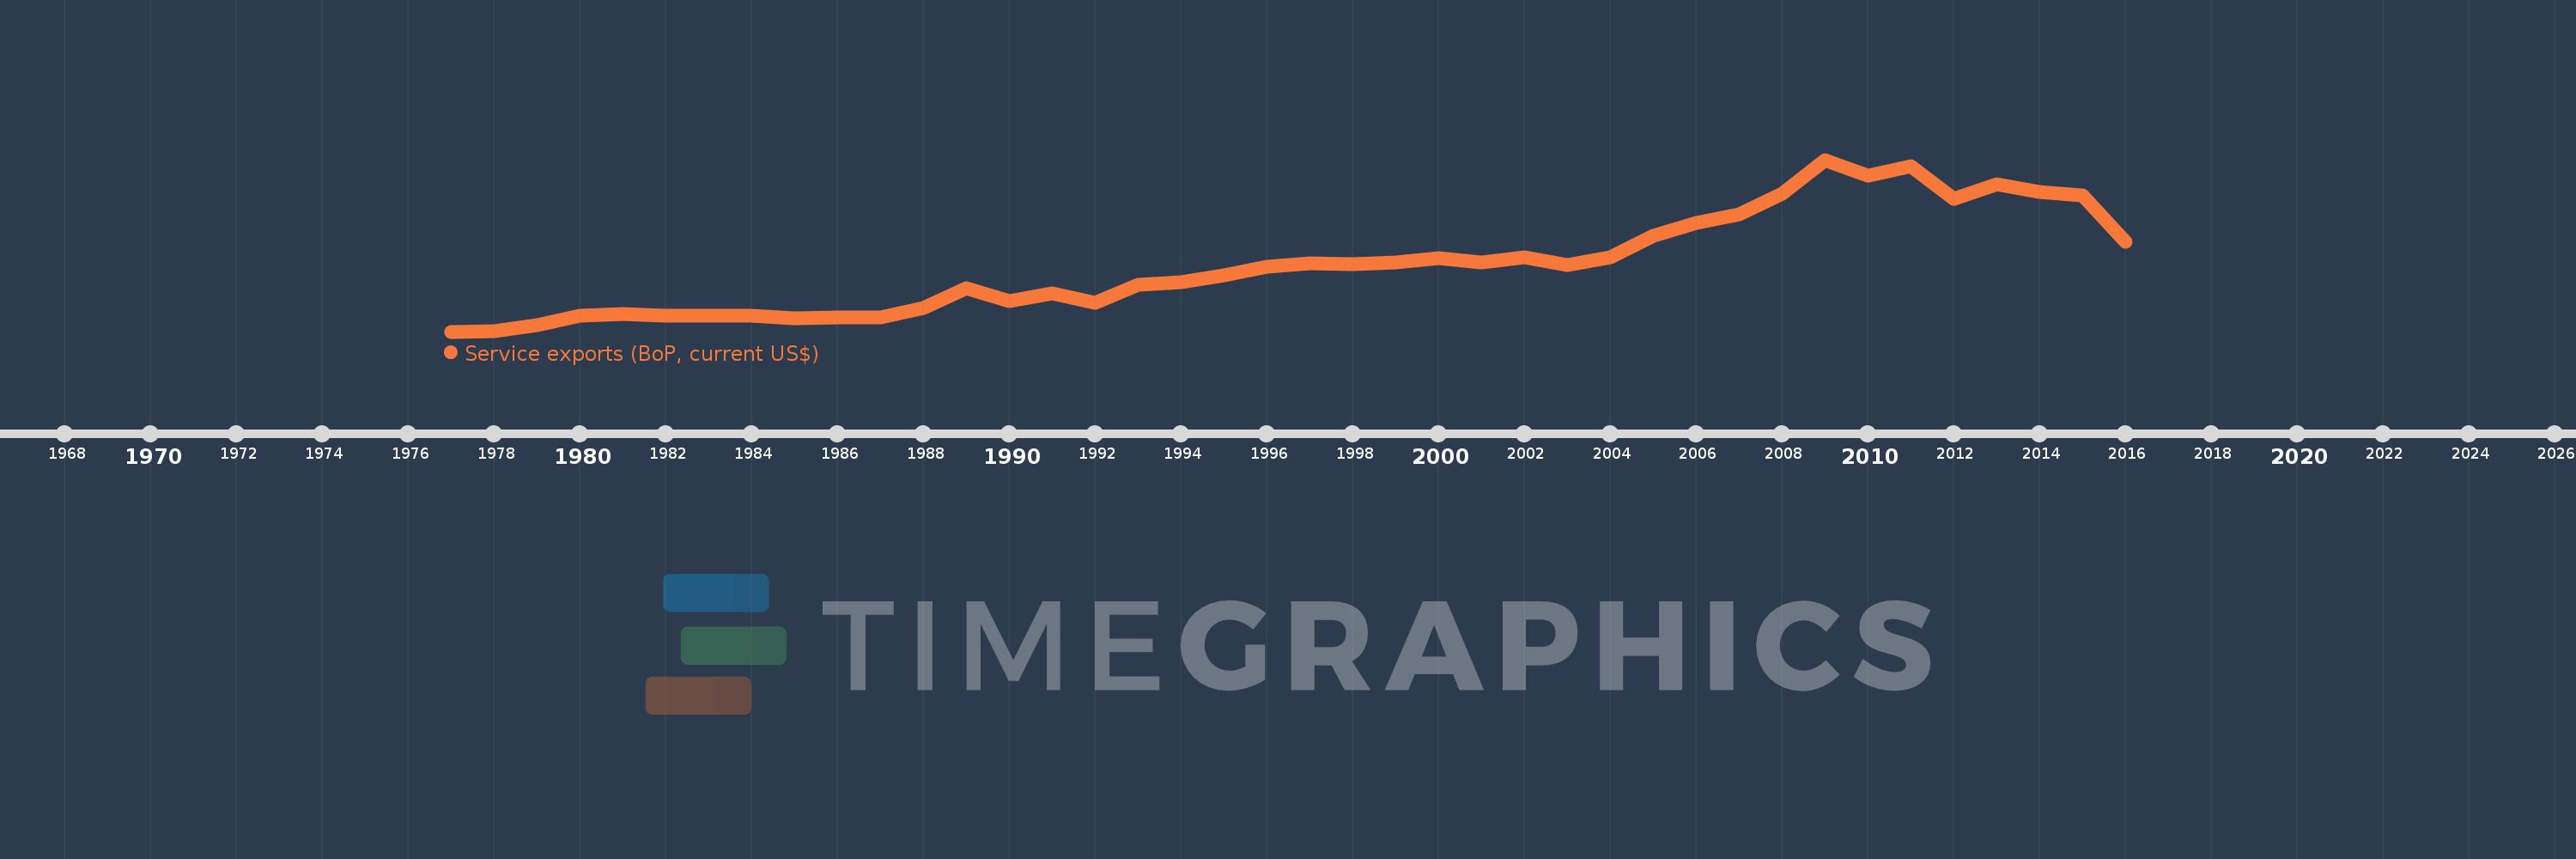
Service exports (BoP, current US$)
2016,2015,2014,2013,2012,2011,2010,2009,2008,2007,2006,2005,2004,2003,2002,2001,2000,1999,1998,1997,1996,1995,1994,1993,1992,1991,1990,1989,1988,1987,1986,1985,1984,1983,1982,1981,1980,1979,1978,1977
This statistics in other country:
AfghanistanAlbaniaAlgeriaAngolaAntigua and BarbudaArab WorldArgentinaArmeniaArubaAustraliaAustriaAzerbaijanBahamas, TheBahrainBangladeshBarbadosBelarusBelgiumBelizeBeninBermudaBhutanBoliviaBosnia and HerzegovinaBotswanaBrazilBrunei DarussalamBulgariaBurkina FasoBurundiCabo VerdeCambodiaCameroonCanadaCaribbean small statesCentral African RepublicCentral Europe and the BalticsChadChileChinaColombiaComorosCongo, Dem. Rep.Congo, Rep.Costa RicaCote d'IvoireCroatiaCuracaoCyprusCzech RepublicDenmarkDjiboutiDominicaDominican RepublicEarly-demographic dividendEast Asia & PacificEast Asia & Pacific (excluding high income)East Asia & Pacific (IDA & IBRD countries)EcuadorEgypt, Arab Rep.El SalvadorEquatorial GuineaEritreaEstoniaEthiopiaEuro areaEurope & Central AsiaEurope & Central Asia (excluding high income)Europe & Central Asia (IDA & IBRD countries)European UnionFaroe IslandsFijiFinlandFragile and conflict affected situationsFranceFrench PolynesiaGabonGambia, TheGeorgiaGermanyGhanaGreeceGrenadaGuatemalaGuineaGuinea-BissauGuyanaHaitiHeavily indebted poor countries (HIPC)High incomeHondurasHong Kong SAR, ChinaHungaryIBRD onlyIcelandIDA & IBRD totalIDA blendIDA onlyIDA totalIndiaIndonesiaIran, Islamic Rep.IraqIrelandIsraelItalyJamaicaJapanJordanKazakhstanKenyaKiribatiKorea, Rep.KosovoKuwaitKyrgyz RepublicLao PDRLate-demographic dividendLatin America & Caribbean Latin America & Caribbean (excluding high income)Latin America & the Caribbean (IDA & IBRD countries)LatviaLeast developed countries: UN classificationLebanonLesothoLiberiaLibyaLithuaniaLow & middle incomeLow incomeLower middle incomeLuxembourgMacao SAR, ChinaMacedonia, FYRMadagascarMalawiMalaysiaMaldivesMaliMaltaMarshall IslandsMauritaniaMauritiusMexicoMicronesia, Fed. Sts.Middle East & North Africa (excluding high income)Middle East & North Africa (IDA & IBRD countries)Middle incomeMoldovaMongoliaMontenegroMoroccoMozambiqueMyanmarNamibiaNepalNetherlandsNew CaledoniaNew ZealandNicaraguaNigerNigeriaNorth AmericaNorwayOECD membersOmanPacific island small statesPakistanPalauPanamaPapua New GuineaParaguayPeruPhilippinesPolandPortugalPost-demographic dividendPre-demographic dividendQatarRomaniaRussian FederationRwandaSamoaSao Tome and PrincipeSaudi ArabiaSenegalSerbiaSeychellesSierra LeoneSingaporeSint Maarten (Dutch part)Slovak RepublicSloveniaSolomon IslandsSouth AfricaSouth AsiaSouth Asia (IDA & IBRD)South SudanSpainSri LankaSt. Kitts and NevisSt. LuciaSt. Vincent and the GrenadinesSub-Saharan Africa Sub-Saharan Africa (excluding high income)Sub-Saharan Africa (IDA & IBRD countries)SudanSurinameSwazilandSwedenSwitzerlandSyrian Arab RepublicTajikistanTanzaniaThailandTimor-LesteTogoTongaTrinidad and TobagoTunisiaTurkeyTuvaluUgandaUkraineUnited KingdomUnited StatesUpper middle incomeUruguayVanuatuVenezuela, RBVietnamWest Bank and GazaWorldYemen, Rep.ZambiaZimbabwe Timeline:
This timeline shows a graph from 1977 to 2016 of Tunisia. No data until 1976. Number of actual observations by date: 40.
Source name:
World Development Indicators
Source organization:
International Monetary Fund, Balance of Payments Statistics Yearbook and data files.
Categories, topics:
Economy & Growth, Trade
Last updated:
apr 23, 2017
Indicators value changes by year
Minimum:
515.422 mln
jan 1, 1977
Maximum:
5.831 bln
jan 1, 2009
At the date of observation
Value
Absolute change
Change from previous value
jan 1, 1977
515.422 mln
+515.422 mln
0.0%
jan 1, 1978
538.524 mln
+23.102 mln
4.48%
jan 1, 1979
711.246 mln
+172.722 mln
32.07%
jan 1, 1980
998.862 mln
+287.616 mln
40.44%
jan 1, 1981
1.067 bln
+67.925 mln
6.8%
jan 1, 1982
994.321 mln
-72.466 mln
-6.79%
jan 1, 1983
997.143 mln
+2.822 mln
0.28%
jan 1, 1984
1.003 bln
+6.147 mln
0.62%
jan 1, 1985
915.254 mln
-88.036 mln
-8.77%
jan 1, 1986
964.654 mln
+49.4 mln
5.4%
jan 1, 1987
959.662 mln
-4.992 mln
-0.52%
jan 1, 1988
1.241 bln
+280.891 mln
29.27%
jan 1, 1989
1.854 bln
+613.017 mln
49.41%
jan 1, 1990
1.446 bln
-407.273 mln
-21.97%
jan 1, 1991
1.688 bln
+242.128 mln
16.74%
jan 1, 1992
1.41 bln
-278.117 mln
-16.47%
jan 1, 1993
1.972 bln
+561.576 mln
39.82%
jan 1, 1994
2.04 bln
+68.482 mln
3.47%
jan 1, 1995
2.267 bln
+226.443 mln
11.1%
jan 1, 1996
2.509 bln
+242.311 mln
10.69%
jan 1, 1997
2.632 bln
+122.869 mln
4.9%
jan 1, 1998
2.613 bln
-18.752 mln
-0.71%
jan 1, 1999
2.655 bln
+41.487 mln
1.59%
jan 1, 2000
2.801 bln
+146.6 mln
5.52%
jan 1, 2001
2.659 bln
-142.796 mln
-5.1%
jan 1, 2002
2.81 bln
+151.623 mln
5.7%
jan 1, 2003
2.566 bln
-244.269 mln
-8.69%
jan 1, 2004
2.806 bln
+239.797 mln
9.35%
jan 1, 2005
3.477 bln
+671.733 mln
23.94%
jan 1, 2006
3.877 bln
+399.397 mln
11.49%
jan 1, 2007
4.153 bln
+276.232 mln
7.13%
jan 1, 2008
4.772 bln
+619.083 mln
14.91%
jan 1, 2009
5.831 bln
+1.059 bln
22.2%
jan 1, 2010
5.334 bln
-497.596 mln
-8.53%
jan 1, 2011
5.632 bln
+297.883 mln
5.58%
jan 1, 2012
4.618 bln
-1.013 bln
-17.99%
jan 1, 2013
5.077 bln
+458.34 mln
9.92%
jan 1, 2014
4.831 bln
-245.987 mln
-4.85%
jan 1, 2015
4.734 bln
-96.909 mln
-2.01%
jan 1, 2016
3.294 bln
-1.44 bln
-30.41%
Ranking of countries by current statistics by years


Comments: