29
/
en
AIzaSyAYiBZKx7MnpbEhh9jyipgxe19OcubqV5w
April 1, 2024
246298
South Africa
ZAF
true
2
1
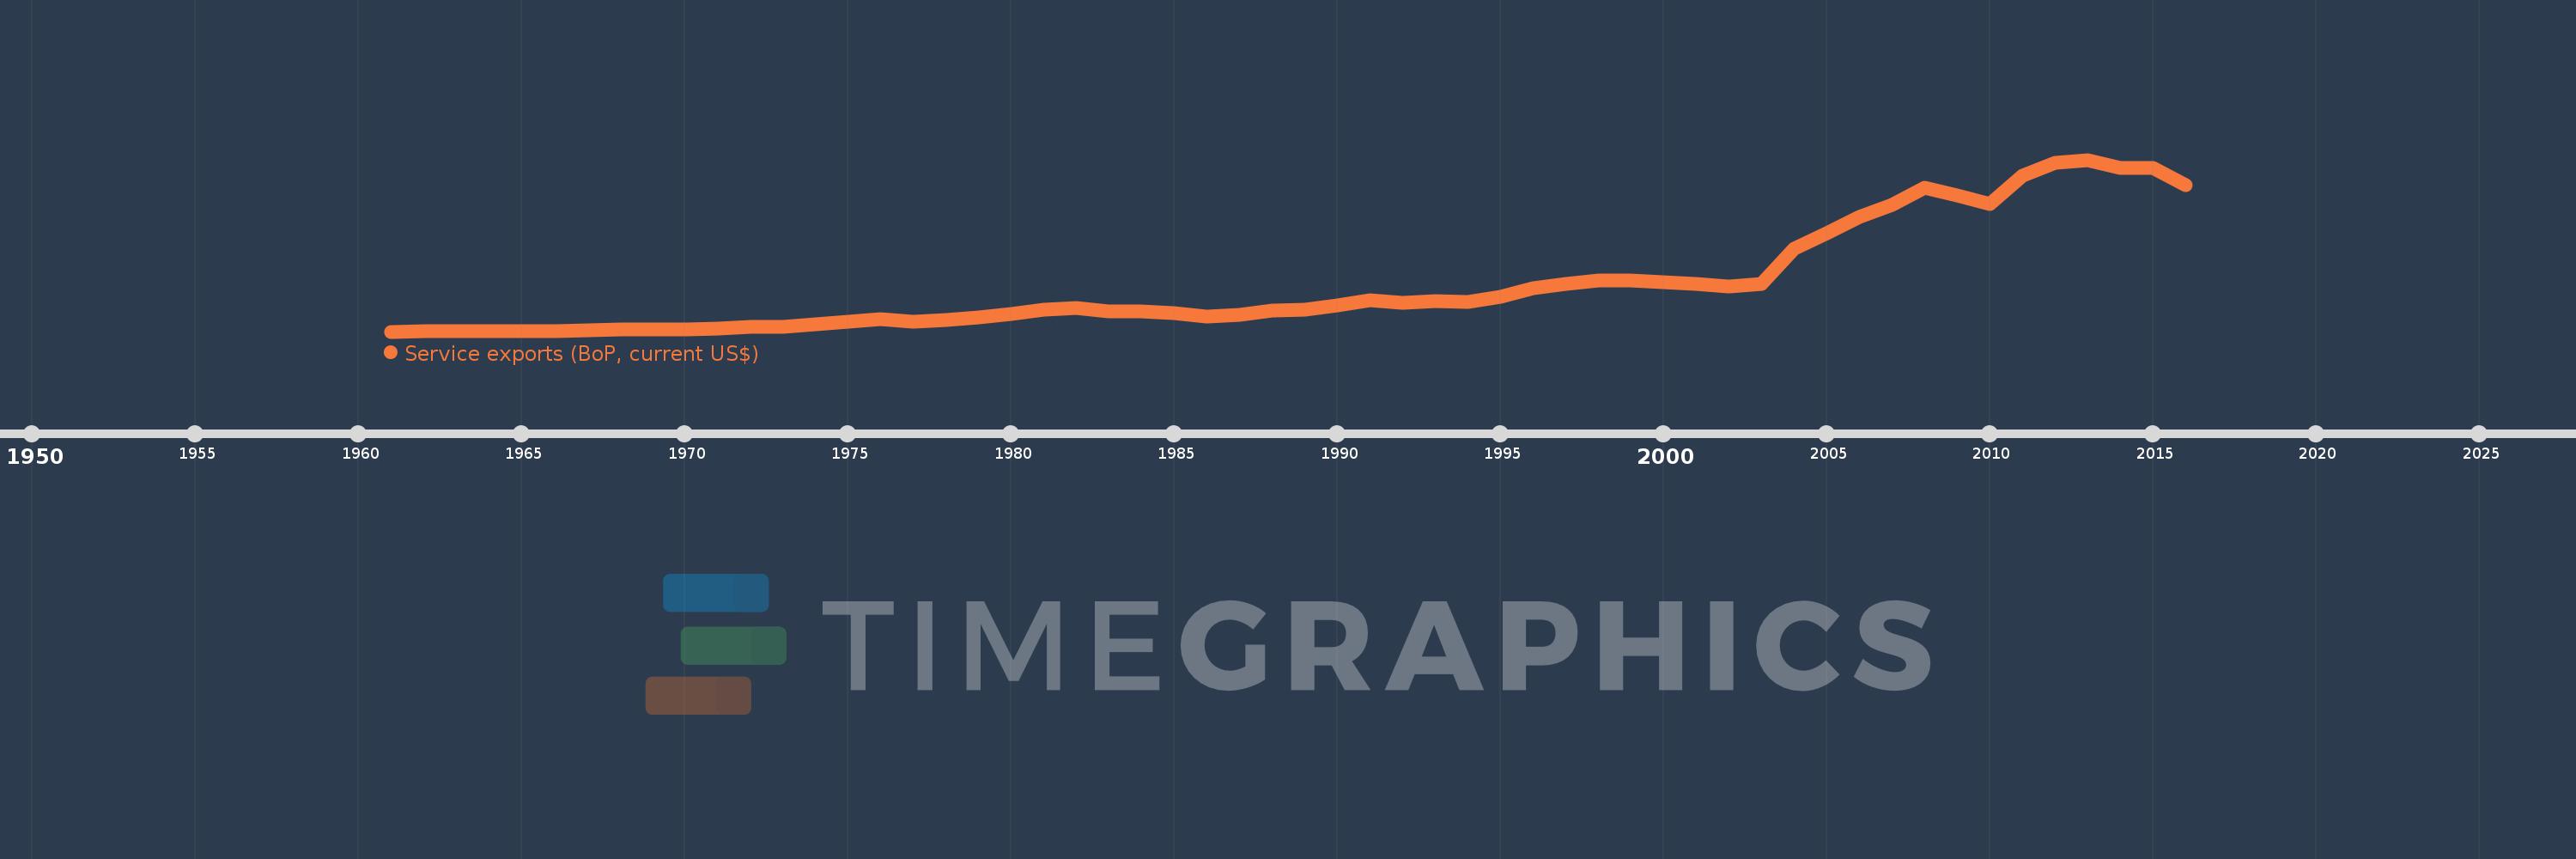
Service exports (BoP, current US$)
2016,2015,2014,2013,2012,2011,2010,2009,2008,2007,2006,2005,2004,2003,2002,2001,2000,1999,1998,1997,1996,1995,1994,1993,1992,1991,1990,1989,1988,1987,1986,1985,1984,1983,1982,1981,1980,1979,1978,1977,1976,1975,1974,1973,1972,1971,1970,1969,1968,1967,1966,1965,1964,1963,1962,1961
This statistics in other country:
AfghanistanAlbaniaAlgeriaAngolaAntigua and BarbudaArab WorldArgentinaArmeniaArubaAustraliaAustriaAzerbaijanBahamas, TheBahrainBangladeshBarbadosBelarusBelgiumBelizeBeninBermudaBhutanBoliviaBosnia and HerzegovinaBotswanaBrazilBrunei DarussalamBulgariaBurkina FasoBurundiCabo VerdeCambodiaCameroonCanadaCaribbean small statesCentral African RepublicCentral Europe and the BalticsChadChileChinaColombiaComorosCongo, Dem. Rep.Congo, Rep.Costa RicaCote d'IvoireCroatiaCuracaoCyprusCzech RepublicDenmarkDjiboutiDominicaDominican RepublicEarly-demographic dividendEast Asia & PacificEast Asia & Pacific (excluding high income)East Asia & Pacific (IDA & IBRD countries)EcuadorEgypt, Arab Rep.El SalvadorEquatorial GuineaEritreaEstoniaEthiopiaEuro areaEurope & Central AsiaEurope & Central Asia (excluding high income)Europe & Central Asia (IDA & IBRD countries)European UnionFaroe IslandsFijiFinlandFragile and conflict affected situationsFranceFrench PolynesiaGabonGambia, TheGeorgiaGermanyGhanaGreeceGrenadaGuatemalaGuineaGuinea-BissauGuyanaHaitiHeavily indebted poor countries (HIPC)High incomeHondurasHong Kong SAR, ChinaHungaryIBRD onlyIcelandIDA & IBRD totalIDA blendIDA onlyIDA totalIndiaIndonesiaIran, Islamic Rep.IraqIrelandIsraelItalyJamaicaJapanJordanKazakhstanKenyaKiribatiKorea, Rep.KosovoKuwaitKyrgyz RepublicLao PDRLate-demographic dividendLatin America & Caribbean Latin America & Caribbean (excluding high income)Latin America & the Caribbean (IDA & IBRD countries)LatviaLeast developed countries: UN classificationLebanonLesothoLiberiaLibyaLithuaniaLow & middle incomeLow incomeLower middle incomeLuxembourgMacao SAR, ChinaMacedonia, FYRMadagascarMalawiMalaysiaMaldivesMaliMaltaMarshall IslandsMauritaniaMauritiusMexicoMicronesia, Fed. Sts.Middle East & North Africa (excluding high income)Middle East & North Africa (IDA & IBRD countries)Middle incomeMoldovaMongoliaMontenegroMoroccoMozambiqueMyanmarNamibiaNepalNetherlandsNew CaledoniaNew ZealandNicaraguaNigerNigeriaNorth AmericaNorwayOECD membersOmanPacific island small statesPakistanPalauPanamaPapua New GuineaParaguayPeruPhilippinesPolandPortugalPost-demographic dividendPre-demographic dividendQatarRomaniaRussian FederationRwandaSamoaSao Tome and PrincipeSaudi ArabiaSenegalSerbiaSeychellesSierra LeoneSingaporeSint Maarten (Dutch part)Slovak RepublicSloveniaSolomon IslandsSouth AfricaSouth AsiaSouth Asia (IDA & IBRD)South SudanSpainSri LankaSt. Kitts and NevisSt. LuciaSt. Vincent and the GrenadinesSub-Saharan Africa Sub-Saharan Africa (excluding high income)Sub-Saharan Africa (IDA & IBRD countries)SudanSurinameSwazilandSwedenSwitzerlandSyrian Arab RepublicTajikistanTanzaniaThailandTimor-LesteTogoTongaTrinidad and TobagoTunisiaTurkeyTuvaluUgandaUkraineUnited KingdomUnited StatesUpper middle incomeUruguayVanuatuVenezuela, RBVietnamWest Bank and GazaWorldYemen, Rep.ZambiaZimbabwe Timeline:
This timeline shows a graph from 1961 to 2016 of South Africa. No data until 1960. Number of actual observations by date: 56.
Source name:
World Development Indicators
Source organization:
International Monetary Fund, Balance of Payments Statistics Yearbook and data files.
Categories, topics:
Economy & Growth, Trade
Last updated:
apr 23, 2017
Indicators value changes by year
Minimum:
250.6 mln
jan 1, 1961
Maximum:
17.64 bln
jan 1, 2013
At the date of observation
Value
Absolute change
Change from previous value
jan 1, 1961
250.6 mln
+250.6 mln
0.0%
jan 1, 1962
257.6 mln
+7.0 mln
2.79%
jan 1, 1963
268.8 mln
+11.2 mln
4.35%
jan 1, 1964
302.4 mln
+33.6 mln
12.5%
jan 1, 1965
309.4 mln
+7.0 mln
2.31%
jan 1, 1966
327.6 mln
+18.2 mln
5.88%
jan 1, 1967
378.0 mln
+50.4 mln
15.38%
jan 1, 1968
427.0 mln
+49.0 mln
12.96%
jan 1, 1969
469.0 mln
+42.0 mln
9.84%
jan 1, 1970
506.8 mln
+37.8 mln
8.06%
jan 1, 1971
588.0 mln
+81.2 mln
16.02%
jan 1, 1972
703.19 mln
+115.191 mln
19.59%
jan 1, 1973
743.748 mln
+40.557 mln
5.77%
jan 1, 1974
991.571 mln
+247.824 mln
33.32%
jan 1, 1975
1.249 bln
+257.523 mln
25.97%
jan 1, 1976
1.484 bln
+234.854 mln
18.8%
jan 1, 1977
1.281 bln
-202.848 mln
-13.67%
jan 1, 1978
1.419 bln
+138.0 mln
10.77%
jan 1, 1979
1.677 bln
+257.6 mln
18.15%
jan 1, 1980
2.029 bln
+352.412 mln
21.02%
jan 1, 1981
2.488 bln
+459.146 mln
22.63%
jan 1, 1982
2.612 bln
+124.116 mln
4.99%
jan 1, 1983
2.329 bln
-283.757 mln
-10.86%
jan 1, 1984
2.295 bln
-33.444 mln
-1.44%
jan 1, 1985
2.132 bln
-163.569 mln
-7.13%
jan 1, 1986
1.767 bln
-364.737 mln
-17.11%
jan 1, 1987
1.927 bln
+160.524 mln
9.09%
jan 1, 1988
2.352 bln
+424.401 mln
22.02%
jan 1, 1989
2.43 bln
+78.439 mln
3.34%
jan 1, 1990
2.915 bln
+485.121 mln
19.96%
jan 1, 1991
3.434 bln
+518.621 mln
17.79%
jan 1, 1992
3.191 bln
-242.946 mln
-7.07%
jan 1, 1993
3.353 bln
+162.327 mln
5.09%
jan 1, 1994
3.278 bln
-75.793 mln
-2.26%
jan 1, 1995
3.751 bln
+473.092 mln
14.43%
jan 1, 1996
4.619 bln
+868.037 mln
23.14%
jan 1, 1997
5.069 bln
+449.973 mln
9.74%
jan 1, 1998
5.394 bln
+325.822 mln
6.43%
jan 1, 1999
5.396 bln
+1.474 mln
0.03%
jan 1, 2000
5.21 bln
-186.084 mln
-3.45%
jan 1, 2001
5.046 bln
-164.27 mln
-3.15%
jan 1, 2002
4.845 bln
-200.333 mln
-3.97%
jan 1, 2003
5.11 bln
+265.005 mln
5.47%
jan 1, 2004
8.659 bln
+3.549 bln
69.44%
jan 1, 2005
10.199 bln
+1.54 bln
17.79%
jan 1, 2006
11.829 bln
+1.63 bln
15.98%
jan 1, 2007
13.059 bln
+1.23 bln
10.4%
jan 1, 2008
14.84 bln
+1.78 bln
13.63%
jan 1, 2009
13.999 bln
-840.854 mln
-5.67%
jan 1, 2010
13.201 bln
-798.099 mln
-5.7%
jan 1, 2011
16.063 bln
+2.862 bln
21.68%
jan 1, 2012
17.346 bln
+1.283 bln
7.99%
jan 1, 2013
17.64 bln
+293.472 mln
1.69%
jan 1, 2014
16.815 bln
-824.628 mln
-4.67%
jan 1, 2015
16.837 bln
+22.11 mln
0.13%
jan 1, 2016
15.054 bln
-1.784 bln
-10.59%
Ranking of countries by current statistics by years


Comments: