29
/
en
AIzaSyAYiBZKx7MnpbEhh9jyipgxe19OcubqV5w
April 1, 2024
43880
Latin America & the Caribbean (IDA & IBRD countries)
TLA
false
2
1
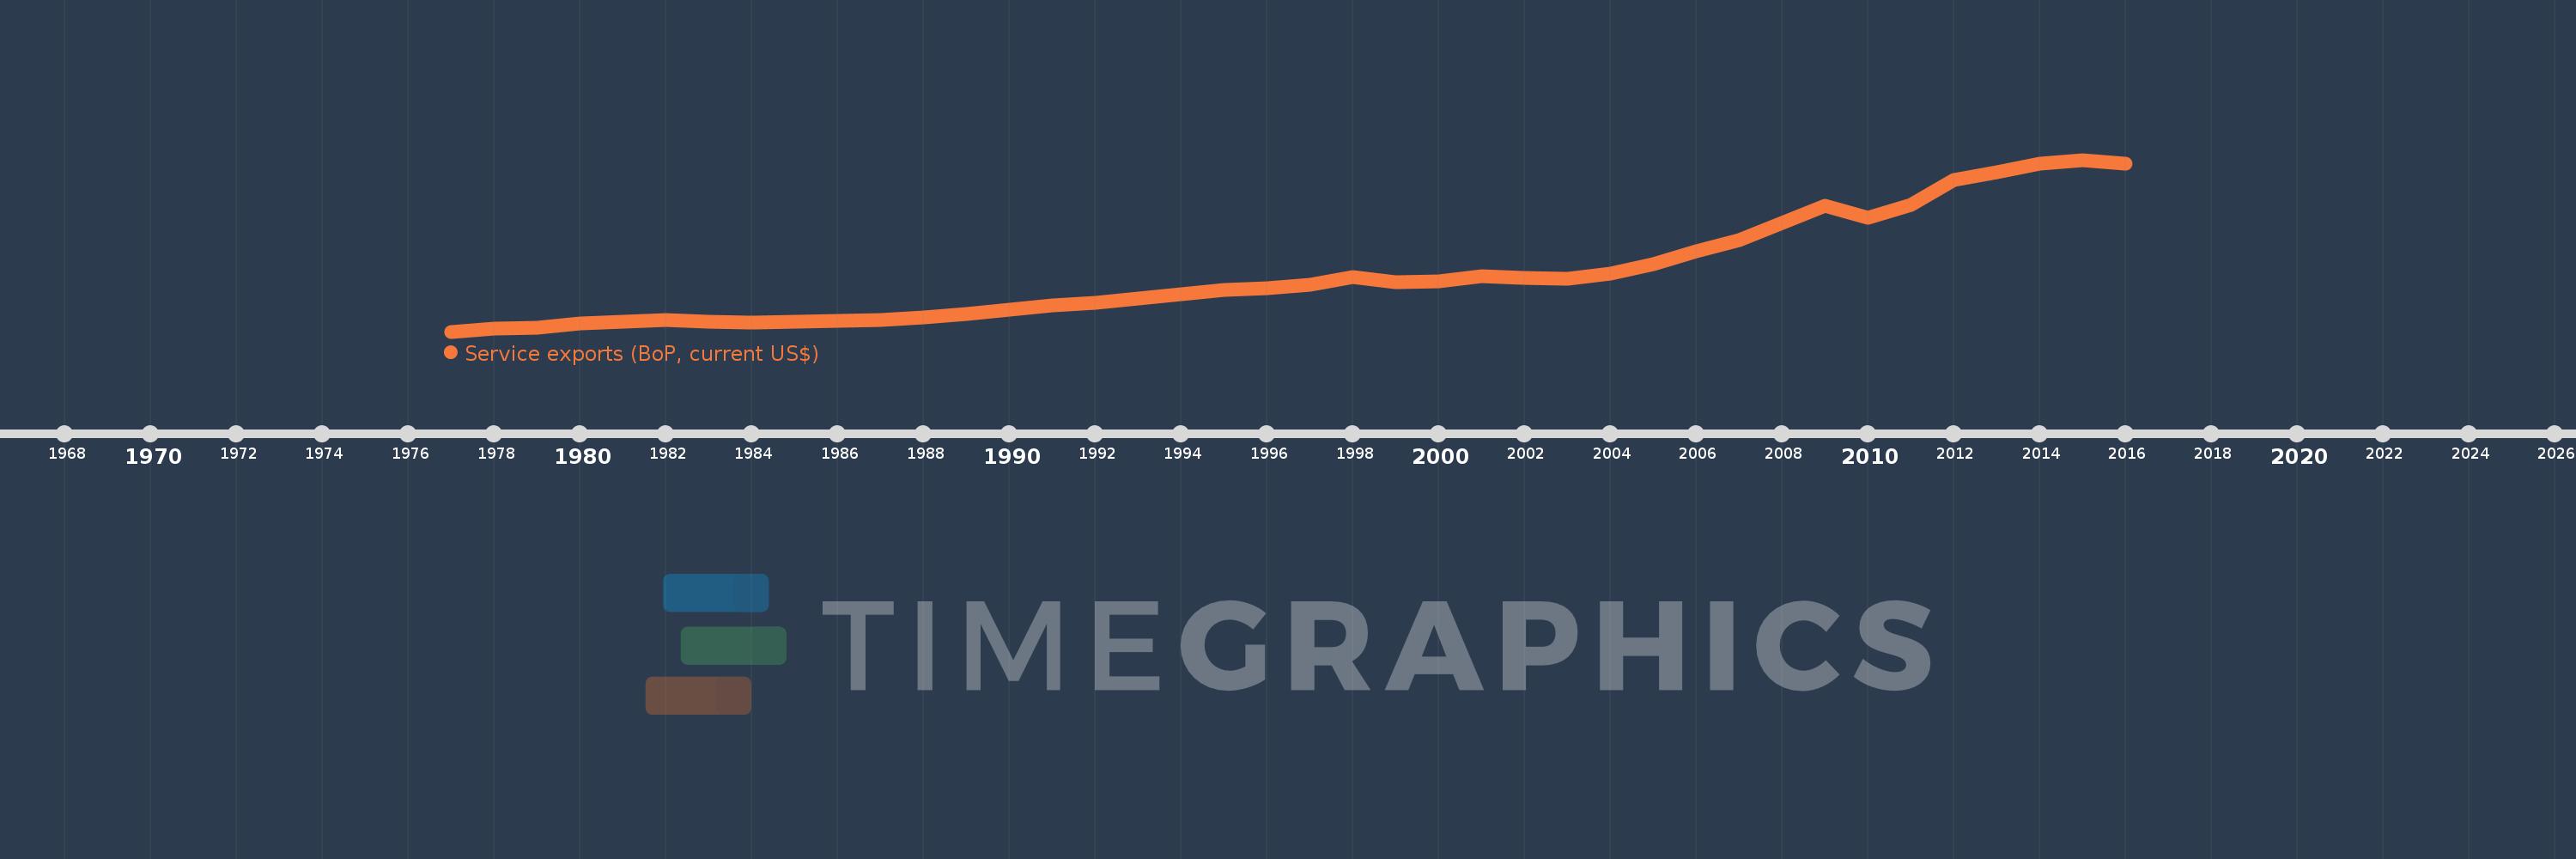
Service exports (BoP, current US$)
2016,2015,2014,2013,2012,2011,2010,2009,2008,2007,2006,2005,2004,2003,2002,2001,2000,1999,1998,1997,1996,1995,1994,1993,1992,1991,1990,1989,1988,1987,1986,1985,1984,1983,1982,1981,1980,1979,1978,1977
This statistics in other country:
AfghanistanAlbaniaAlgeriaAngolaAntigua and BarbudaArab WorldArgentinaArmeniaArubaAustraliaAustriaAzerbaijanBahamas, TheBahrainBangladeshBarbadosBelarusBelgiumBelizeBeninBermudaBhutanBoliviaBosnia and HerzegovinaBotswanaBrazilBrunei DarussalamBulgariaBurkina FasoBurundiCabo VerdeCambodiaCameroonCanadaCaribbean small statesCentral African RepublicCentral Europe and the BalticsChadChileChinaColombiaComorosCongo, Dem. Rep.Congo, Rep.Costa RicaCote d'IvoireCroatiaCuracaoCyprusCzech RepublicDenmarkDjiboutiDominicaDominican RepublicEarly-demographic dividendEast Asia & PacificEast Asia & Pacific (excluding high income)East Asia & Pacific (IDA & IBRD countries)EcuadorEgypt, Arab Rep.El SalvadorEquatorial GuineaEritreaEstoniaEthiopiaEuro areaEurope & Central AsiaEurope & Central Asia (excluding high income)Europe & Central Asia (IDA & IBRD countries)European UnionFaroe IslandsFijiFinlandFragile and conflict affected situationsFranceFrench PolynesiaGabonGambia, TheGeorgiaGermanyGhanaGreeceGrenadaGuatemalaGuineaGuinea-BissauGuyanaHaitiHeavily indebted poor countries (HIPC)High incomeHondurasHong Kong SAR, ChinaHungaryIBRD onlyIcelandIDA & IBRD totalIDA blendIDA onlyIDA totalIndiaIndonesiaIran, Islamic Rep.IraqIrelandIsraelItalyJamaicaJapanJordanKazakhstanKenyaKiribatiKorea, Rep.KosovoKuwaitKyrgyz RepublicLao PDRLate-demographic dividendLatin America & Caribbean Latin America & Caribbean (excluding high income)Latin America & the Caribbean (IDA & IBRD countries)LatviaLeast developed countries: UN classificationLebanonLesothoLiberiaLibyaLithuaniaLow & middle incomeLow incomeLower middle incomeLuxembourgMacao SAR, ChinaMacedonia, FYRMadagascarMalawiMalaysiaMaldivesMaliMaltaMarshall IslandsMauritaniaMauritiusMexicoMicronesia, Fed. Sts.Middle East & North Africa (excluding high income)Middle East & North Africa (IDA & IBRD countries)Middle incomeMoldovaMongoliaMontenegroMoroccoMozambiqueMyanmarNamibiaNepalNetherlandsNew CaledoniaNew ZealandNicaraguaNigerNigeriaNorth AmericaNorwayOECD membersOmanPacific island small statesPakistanPalauPanamaPapua New GuineaParaguayPeruPhilippinesPolandPortugalPost-demographic dividendPre-demographic dividendQatarRomaniaRussian FederationRwandaSamoaSao Tome and PrincipeSaudi ArabiaSenegalSerbiaSeychellesSierra LeoneSingaporeSint Maarten (Dutch part)Slovak RepublicSloveniaSolomon IslandsSouth AfricaSouth AsiaSouth Asia (IDA & IBRD)South SudanSpainSri LankaSt. Kitts and NevisSt. LuciaSt. Vincent and the GrenadinesSub-Saharan Africa Sub-Saharan Africa (excluding high income)Sub-Saharan Africa (IDA & IBRD countries)SudanSurinameSwazilandSwedenSwitzerlandSyrian Arab RepublicTajikistanTanzaniaThailandTimor-LesteTogoTongaTrinidad and TobagoTunisiaTurkeyTuvaluUgandaUkraineUnited KingdomUnited StatesUpper middle incomeUruguayVanuatuVenezuela, RBVietnamWest Bank and GazaWorldYemen, Rep.ZambiaZimbabwe Timeline:
This timeline shows a graph from 1977 to 2016 of Latin America & the Caribbean (IDA & IBRD countries). No data until 1976. Number of actual observations by date: 40.
Source name:
World Development Indicators
Source organization:
International Monetary Fund, Balance of Payments Statistics Yearbook and data files.
Categories, topics:
Economy & Growth, Trade
Last updated:
apr 23, 2017
Indicators value changes by year
Minimum:
8.405 bln
jan 1, 1977
Maximum:
154.616 bln
jan 1, 2015
At the date of observation
Value
Absolute change
Change from previous value
jan 1, 1977
8.405 bln
+8.405 bln
0.0%
jan 1, 1978
10.606 bln
+2.201 bln
26.19%
jan 1, 1979
11.931 bln
+1.325 bln
12.49%
jan 1, 1980
15.13 bln
+3.199 bln
26.81%
jan 1, 1981
17.101 bln
+1.971 bln
13.03%
jan 1, 1982
17.944 bln
+843.423 mln
4.93%
jan 1, 1983
16.607 bln
-1.337 bln
-7.45%
jan 1, 1984
15.742 bln
-865.38 mln
-5.21%
jan 1, 1985
16.933 bln
+1.191 bln
7.57%
jan 1, 1986
17.838 bln
+904.914 mln
5.34%
jan 1, 1987
18.43 bln
+592.4 mln
3.32%
jan 1, 1988
20.512 bln
+2.082 bln
11.3%
jan 1, 1989
23.162 bln
+2.649 bln
12.92%
jan 1, 1990
27.002 bln
+3.84 bln
16.58%
jan 1, 1991
30.86 bln
+3.858 bln
14.29%
jan 1, 1992
32.728 bln
+1.869 bln
6.06%
jan 1, 1993
36.887 bln
+4.158 bln
12.71%
jan 1, 1994
40.277 bln
+3.39 bln
9.19%
jan 1, 1995
43.877 bln
+3.6 bln
8.94%
jan 1, 1996
45.486 bln
+1.609 bln
3.67%
jan 1, 1997
48.473 bln
+2.987 bln
6.57%
jan 1, 1998
54.721 bln
+6.248 bln
12.89%
jan 1, 1999
50.283 bln
-4.438 bln
-8.11%
jan 1, 2000
51.08 bln
+796.747 mln
1.58%
jan 1, 2001
55.557 bln
+4.477 bln
8.77%
jan 1, 2002
54.25 bln
-1.307 bln
-2.35%
jan 1, 2003
53.372 bln
-877.517 mln
-1.62%
jan 1, 2004
57.854 bln
+4.482 bln
8.4%
jan 1, 2005
65.894 bln
+8.04 bln
13.9%
jan 1, 2006
77.025 bln
+11.131 bln
16.89%
jan 1, 2007
86.54 bln
+9.515 bln
12.35%
jan 1, 2008
100.531 bln
+13.991 bln
16.17%
jan 1, 2009
115.559 bln
+15.028 bln
14.95%
jan 1, 2010
105.075 bln
-10.484 bln
-9.07%
jan 1, 2011
116.376 bln
+11.301 bln
10.76%
jan 1, 2012
137.45 bln
+21.074 bln
18.11%
jan 1, 2013
144.064 bln
+6.613 bln
4.81%
jan 1, 2014
151.106 bln
+7.042 bln
4.89%
jan 1, 2015
154.616 bln
+3.51 bln
2.32%
jan 1, 2016
151.324 bln
-3.292 bln
-2.13%
Ranking of countries by current statistics by years


Comments: