29
/
en
AIzaSyAYiBZKx7MnpbEhh9jyipgxe19OcubqV5w
April 1, 2024
58540
South Asia (IDA & IBRD)
TSA
false
2
1
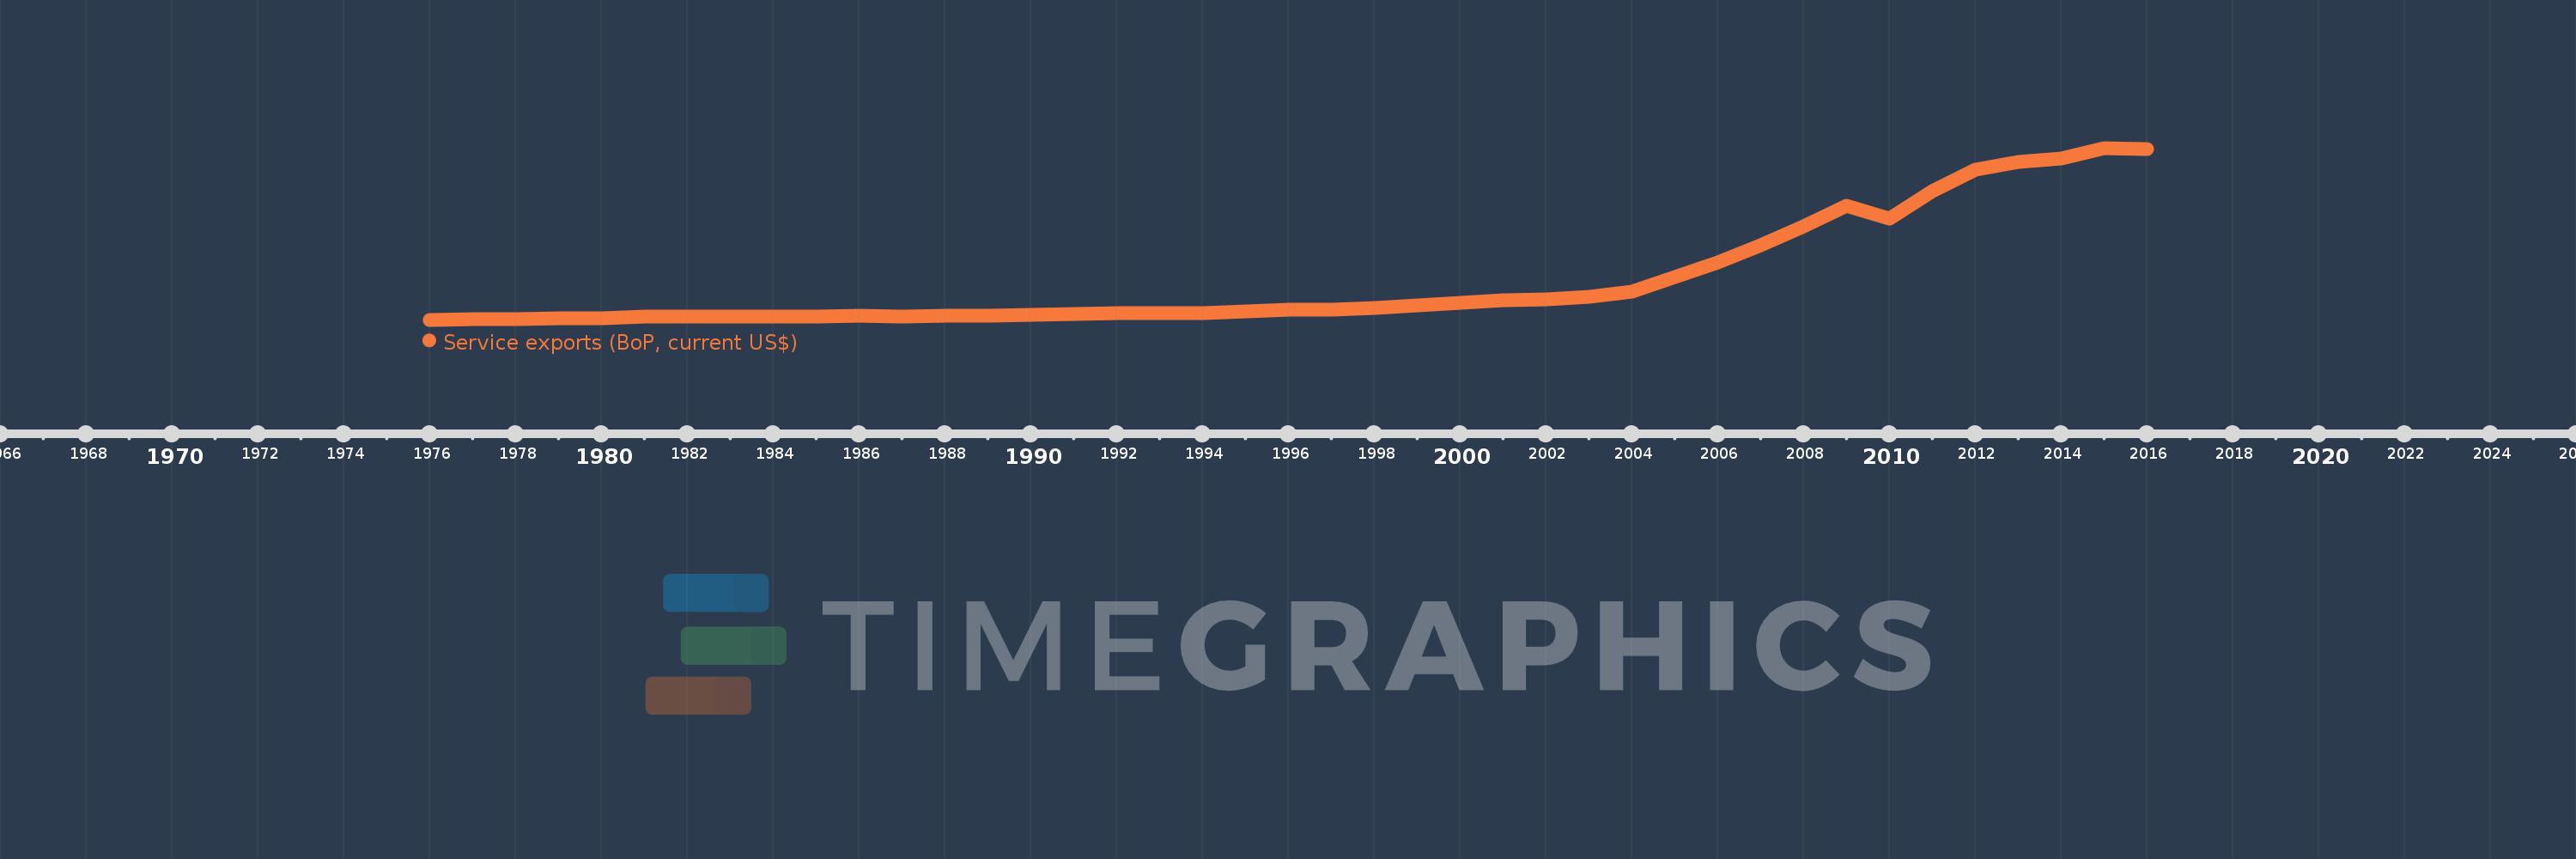
Service exports (BoP, current US$)
2016,2015,2014,2013,2012,2011,2010,2009,2008,2007,2006,2005,2004,2003,2002,2001,2000,1999,1998,1997,1996,1995,1994,1993,1992,1991,1990,1989,1988,1987,1986,1985,1984,1983,1982,1981,1980,1979,1978,1977,1976
This statistics in other country:
AfghanistanAlbaniaAlgeriaAngolaAntigua and BarbudaArab WorldArgentinaArmeniaArubaAustraliaAustriaAzerbaijanBahamas, TheBahrainBangladeshBarbadosBelarusBelgiumBelizeBeninBermudaBhutanBoliviaBosnia and HerzegovinaBotswanaBrazilBrunei DarussalamBulgariaBurkina FasoBurundiCabo VerdeCambodiaCameroonCanadaCaribbean small statesCentral African RepublicCentral Europe and the BalticsChadChileChinaColombiaComorosCongo, Dem. Rep.Congo, Rep.Costa RicaCote d'IvoireCroatiaCuracaoCyprusCzech RepublicDenmarkDjiboutiDominicaDominican RepublicEarly-demographic dividendEast Asia & PacificEast Asia & Pacific (excluding high income)East Asia & Pacific (IDA & IBRD countries)EcuadorEgypt, Arab Rep.El SalvadorEquatorial GuineaEritreaEstoniaEthiopiaEuro areaEurope & Central AsiaEurope & Central Asia (excluding high income)Europe & Central Asia (IDA & IBRD countries)European UnionFaroe IslandsFijiFinlandFragile and conflict affected situationsFranceFrench PolynesiaGabonGambia, TheGeorgiaGermanyGhanaGreeceGrenadaGuatemalaGuineaGuinea-BissauGuyanaHaitiHeavily indebted poor countries (HIPC)High incomeHondurasHong Kong SAR, ChinaHungaryIBRD onlyIcelandIDA & IBRD totalIDA blendIDA onlyIDA totalIndiaIndonesiaIran, Islamic Rep.IraqIrelandIsraelItalyJamaicaJapanJordanKazakhstanKenyaKiribatiKorea, Rep.KosovoKuwaitKyrgyz RepublicLao PDRLate-demographic dividendLatin America & Caribbean Latin America & Caribbean (excluding high income)Latin America & the Caribbean (IDA & IBRD countries)LatviaLeast developed countries: UN classificationLebanonLesothoLiberiaLibyaLithuaniaLow & middle incomeLow incomeLower middle incomeLuxembourgMacao SAR, ChinaMacedonia, FYRMadagascarMalawiMalaysiaMaldivesMaliMaltaMarshall IslandsMauritaniaMauritiusMexicoMicronesia, Fed. Sts.Middle East & North Africa (excluding high income)Middle East & North Africa (IDA & IBRD countries)Middle incomeMoldovaMongoliaMontenegroMoroccoMozambiqueMyanmarNamibiaNepalNetherlandsNew CaledoniaNew ZealandNicaraguaNigerNigeriaNorth AmericaNorwayOECD membersOmanPacific island small statesPakistanPalauPanamaPapua New GuineaParaguayPeruPhilippinesPolandPortugalPost-demographic dividendPre-demographic dividendQatarRomaniaRussian FederationRwandaSamoaSao Tome and PrincipeSaudi ArabiaSenegalSerbiaSeychellesSierra LeoneSingaporeSint Maarten (Dutch part)Slovak RepublicSloveniaSolomon IslandsSouth AfricaSouth AsiaSouth Asia (IDA & IBRD)South SudanSpainSri LankaSt. Kitts and NevisSt. LuciaSt. Vincent and the GrenadinesSub-Saharan Africa Sub-Saharan Africa (excluding high income)Sub-Saharan Africa (IDA & IBRD countries)SudanSurinameSwazilandSwedenSwitzerlandSyrian Arab RepublicTajikistanTanzaniaThailandTimor-LesteTogoTongaTrinidad and TobagoTunisiaTurkeyTuvaluUgandaUkraineUnited KingdomUnited StatesUpper middle incomeUruguayVanuatuVenezuela, RBVietnamWest Bank and GazaWorldYemen, Rep.ZambiaZimbabwe Timeline:
This timeline shows a graph from 1976 to 2016 of South Asia (IDA & IBRD). No data until 1975. Number of actual observations by date: 41.
Source name:
World Development Indicators
Source organization:
International Monetary Fund, Balance of Payments Statistics Yearbook and data files.
Categories, topics:
Economy & Growth, Trade
Last updated:
apr 23, 2017
Indicators value changes by year
Minimum:
1.29 bln
jan 1, 1976
Maximum:
177.531 bln
jan 1, 2015
At the date of observation
Value
Absolute change
Change from previous value
jan 1, 1976
1.29 bln
+1.29 bln
0.0%
jan 1, 1977
1.592 bln
+302.291 mln
23.44%
jan 1, 1978
1.927 bln
+334.742 mln
21.03%
jan 1, 1979
2.398 bln
+471.392 mln
24.46%
jan 1, 1980
3.162 bln
+764.217 mln
31.87%
jan 1, 1981
4.349 bln
+1.187 bln
37.53%
jan 1, 1982
4.22 bln
-129.644 mln
-2.98%
jan 1, 1983
4.555 bln
+335.683 mln
7.96%
jan 1, 1984
4.9 bln
+344.226 mln
7.56%
jan 1, 1985
4.809 bln
-90.684 mln
-1.85%
jan 1, 1986
5.026 bln
+216.858 mln
4.51%
jan 1, 1987
4.896 bln
-130.241 mln
-2.59%
jan 1, 1988
5.285 bln
+389.555 mln
7.96%
jan 1, 1989
5.685 bln
+399.595 mln
7.56%
jan 1, 1990
6.364 bln
+679.565 mln
11.95%
jan 1, 1991
7.268 bln
+903.631 mln
14.2%
jan 1, 1992
7.865 bln
+597.46 mln
8.22%
jan 1, 1993
8.112 bln
+247.026 mln
3.14%
jan 1, 1994
8.427 bln
+314.635 mln
3.88%
jan 1, 1995
10.017 bln
+1.59 bln
18.87%
jan 1, 1996
11.18 bln
+1.162 bln
11.6%
jan 1, 1997
11.797 bln
+617.287 mln
5.52%
jan 1, 1998
13.621 bln
+1.824 bln
15.46%
jan 1, 1999
15.755 bln
+2.134 bln
15.67%
jan 1, 2000
18.779 bln
+3.024 bln
19.19%
jan 1, 2001
20.855 bln
+2.077 bln
11.06%
jan 1, 2002
21.863 bln
+1.008 bln
4.83%
jan 1, 2003
24.96 bln
+3.097 bln
14.17%
jan 1, 2004
30.493 bln
+5.533 bln
22.17%
jan 1, 2005
44.955 bln
+14.463 bln
47.43%
jan 1, 2006
60.179 bln
+15.224 bln
33.86%
jan 1, 2007
77.958 bln
+17.779 bln
29.54%
jan 1, 2008
97.122 bln
+19.164 bln
24.58%
jan 1, 2009
118.093 bln
+20.971 bln
21.59%
jan 1, 2010
104.847 bln
-13.246 bln
-11.22%
jan 1, 2011
133.237 bln
+28.39 bln
27.08%
jan 1, 2012
154.982 bln
+21.745 bln
16.32%
jan 1, 2013
163.269 bln
+8.286 bln
5.35%
jan 1, 2014
166.691 bln
+3.422 bln
2.1%
jan 1, 2015
177.531 bln
+10.84 bln
6.5%
jan 1, 2016
176.762 bln
-768.396 mln
-0.43%
Ranking of countries by current statistics by years


Comments: