29
/
en
AIzaSyAYiBZKx7MnpbEhh9jyipgxe19OcubqV5w
April 1, 2024
35381
Heavily indebted poor countries (HIPC)
HPC
false
2
1
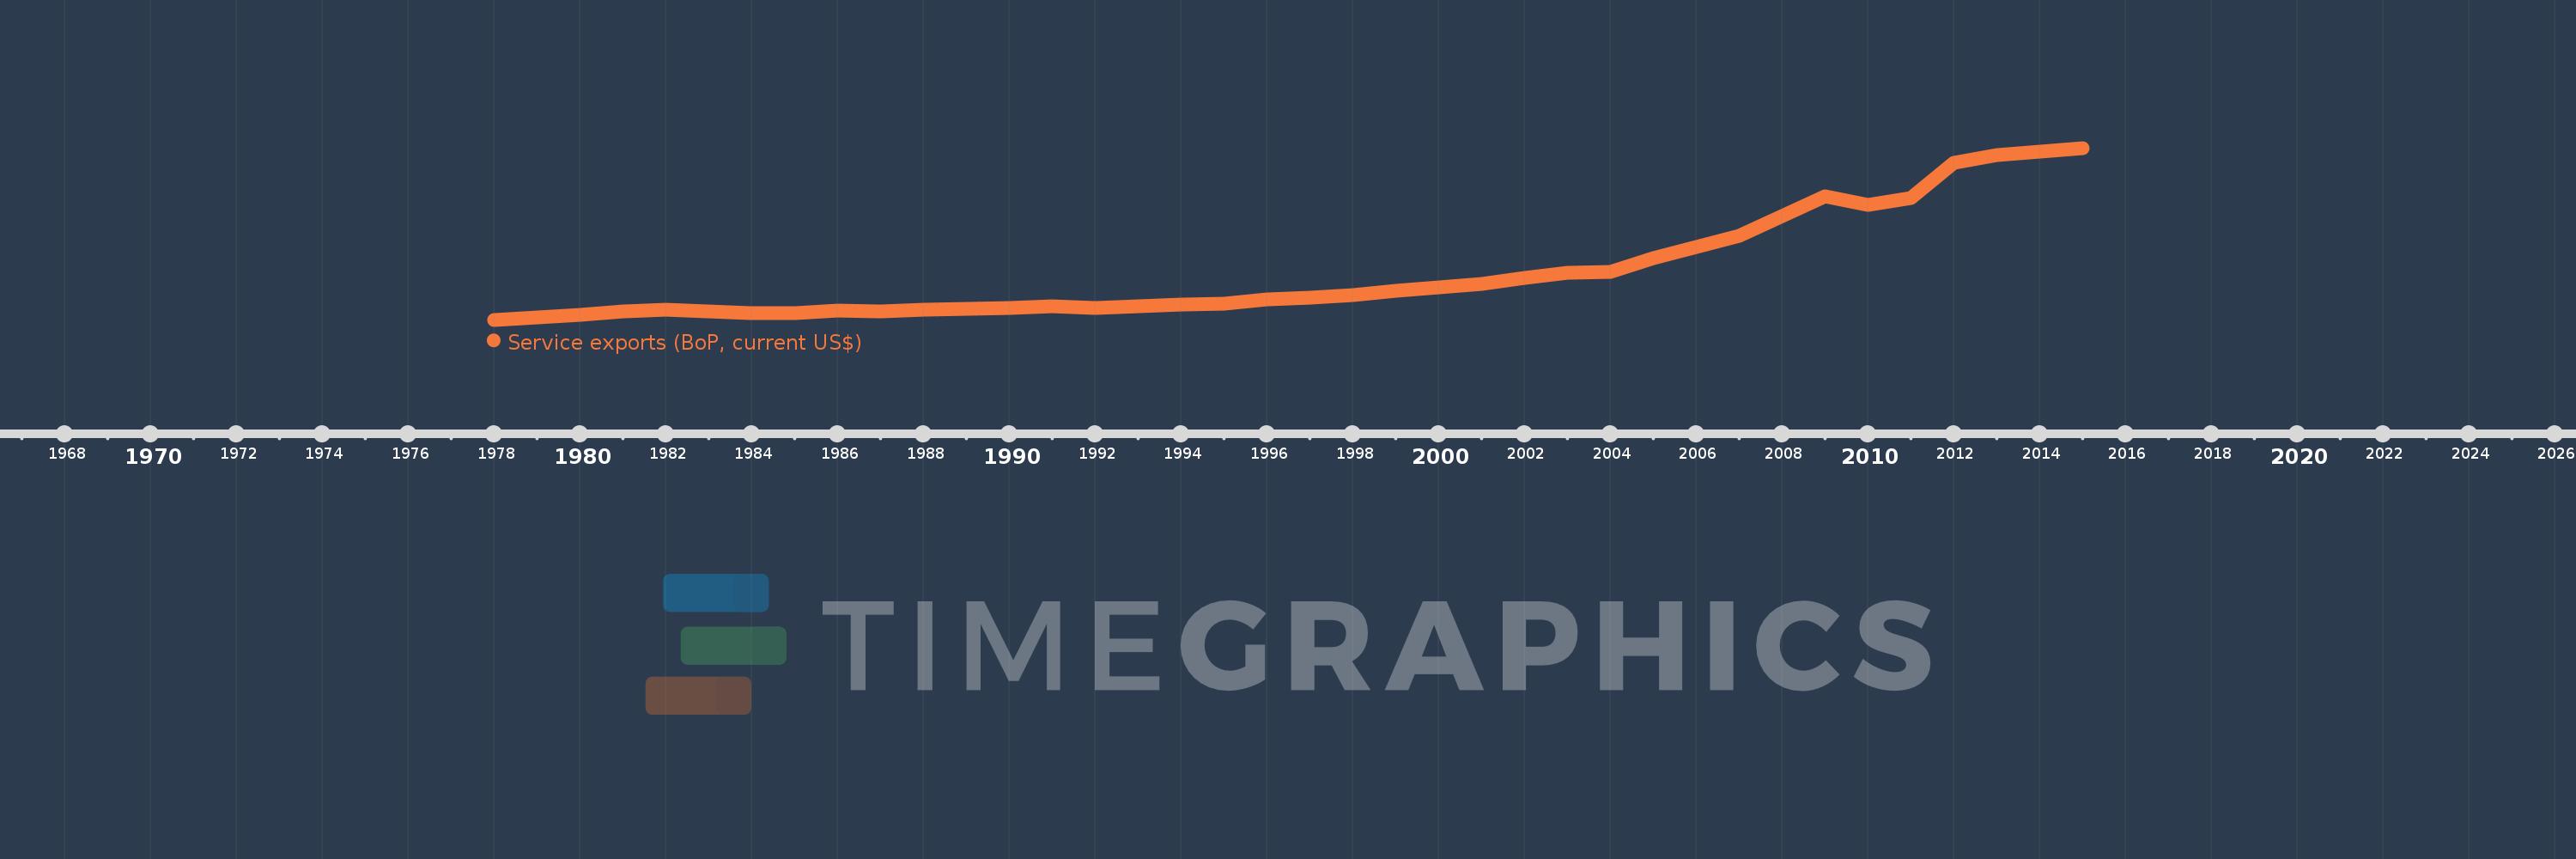
Service exports (BoP, current US$)
2015,2014,2013,2012,2011,2010,2009,2008,2007,2006,2005,2004,2003,2002,2001,2000,1999,1998,1997,1996,1995,1994,1993,1992,1991,1990,1989,1988,1987,1986,1985,1984,1983,1982,1981,1980,1979,1978
This statistics in other country:
AfghanistanAlbaniaAlgeriaAngolaAntigua and BarbudaArab WorldArgentinaArmeniaArubaAustraliaAustriaAzerbaijanBahamas, TheBahrainBangladeshBarbadosBelarusBelgiumBelizeBeninBermudaBhutanBoliviaBosnia and HerzegovinaBotswanaBrazilBrunei DarussalamBulgariaBurkina FasoBurundiCabo VerdeCambodiaCameroonCanadaCaribbean small statesCentral African RepublicCentral Europe and the BalticsChadChileChinaColombiaComorosCongo, Dem. Rep.Congo, Rep.Costa RicaCote d'IvoireCroatiaCuracaoCyprusCzech RepublicDenmarkDjiboutiDominicaDominican RepublicEarly-demographic dividendEast Asia & PacificEast Asia & Pacific (excluding high income)East Asia & Pacific (IDA & IBRD countries)EcuadorEgypt, Arab Rep.El SalvadorEquatorial GuineaEritreaEstoniaEthiopiaEuro areaEurope & Central AsiaEurope & Central Asia (excluding high income)Europe & Central Asia (IDA & IBRD countries)European UnionFaroe IslandsFijiFinlandFragile and conflict affected situationsFranceFrench PolynesiaGabonGambia, TheGeorgiaGermanyGhanaGreeceGrenadaGuatemalaGuineaGuinea-BissauGuyanaHaitiHeavily indebted poor countries (HIPC)High incomeHondurasHong Kong SAR, ChinaHungaryIBRD onlyIcelandIDA & IBRD totalIDA blendIDA onlyIDA totalIndiaIndonesiaIran, Islamic Rep.IraqIrelandIsraelItalyJamaicaJapanJordanKazakhstanKenyaKiribatiKorea, Rep.KosovoKuwaitKyrgyz RepublicLao PDRLate-demographic dividendLatin America & Caribbean Latin America & Caribbean (excluding high income)Latin America & the Caribbean (IDA & IBRD countries)LatviaLeast developed countries: UN classificationLebanonLesothoLiberiaLibyaLithuaniaLow & middle incomeLow incomeLower middle incomeLuxembourgMacao SAR, ChinaMacedonia, FYRMadagascarMalawiMalaysiaMaldivesMaliMaltaMarshall IslandsMauritaniaMauritiusMexicoMicronesia, Fed. Sts.Middle East & North Africa (excluding high income)Middle East & North Africa (IDA & IBRD countries)Middle incomeMoldovaMongoliaMontenegroMoroccoMozambiqueMyanmarNamibiaNepalNetherlandsNew CaledoniaNew ZealandNicaraguaNigerNigeriaNorth AmericaNorwayOECD membersOmanPacific island small statesPakistanPalauPanamaPapua New GuineaParaguayPeruPhilippinesPolandPortugalPost-demographic dividendPre-demographic dividendQatarRomaniaRussian FederationRwandaSamoaSao Tome and PrincipeSaudi ArabiaSenegalSerbiaSeychellesSierra LeoneSingaporeSint Maarten (Dutch part)Slovak RepublicSloveniaSolomon IslandsSouth AfricaSouth AsiaSouth Asia (IDA & IBRD)South SudanSpainSri LankaSt. Kitts and NevisSt. LuciaSt. Vincent and the GrenadinesSub-Saharan Africa Sub-Saharan Africa (excluding high income)Sub-Saharan Africa (IDA & IBRD countries)SudanSurinameSwazilandSwedenSwitzerlandSyrian Arab RepublicTajikistanTanzaniaThailandTimor-LesteTogoTongaTrinidad and TobagoTunisiaTurkeyTuvaluUgandaUkraineUnited KingdomUnited StatesUpper middle incomeUruguayVanuatuVenezuela, RBVietnamWest Bank and GazaWorldYemen, Rep.ZambiaZimbabwe Timeline:
This timeline shows a graph from 1978 to 2015 of Heavily indebted poor countries (HIPC). No data until 1977. Number of actual observations by date: 38.
Source name:
World Development Indicators
Source organization:
International Monetary Fund, Balance of Payments Statistics Yearbook and data files.
Categories, topics:
Economy & Growth, Trade
Last updated:
apr 23, 2017
Indicators value changes by year
Minimum:
2.071 bln
jan 1, 1978
Maximum:
35.606 bln
jan 1, 2015
At the date of observation
Value
Absolute change
Change from previous value
jan 1, 1978
2.071 bln
+2.071 bln
0.0%
jan 1, 1979
2.512 bln
+441.309 mln
21.31%
jan 1, 1980
3.107 bln
+594.793 mln
23.68%
jan 1, 1981
3.664 bln
+557.288 mln
17.94%
jan 1, 1982
3.975 bln
+310.658 mln
8.48%
jan 1, 1983
3.724 bln
-250.361 mln
-6.3%
jan 1, 1984
3.36 bln
-364.46 mln
-9.79%
jan 1, 1985
3.305 bln
-54.868 mln
-1.63%
jan 1, 1986
3.796 bln
+490.749 mln
14.85%
jan 1, 1987
3.702 bln
-93.796 mln
-2.47%
jan 1, 1988
4.04 bln
+337.795 mln
9.12%
jan 1, 1989
4.224 bln
+183.825 mln
4.55%
jan 1, 1990
4.422 bln
+198.639 mln
4.7%
jan 1, 1991
4.621 bln
+198.89 mln
4.5%
jan 1, 1992
4.45 bln
-171.635 mln
-3.71%
jan 1, 1993
4.768 bln
+318.649 mln
7.16%
jan 1, 1994
5.102 bln
+333.716 mln
7.0%
jan 1, 1995
5.232 bln
+130.345 mln
2.55%
jan 1, 1996
6.041 bln
+808.659 mln
15.46%
jan 1, 1997
6.436 bln
+394.786 mln
6.54%
jan 1, 1998
6.867 bln
+431.437 mln
6.7%
jan 1, 1999
7.71 bln
+842.813 mln
12.27%
jan 1, 2000
8.346 bln
+635.524 mln
8.24%
jan 1, 2001
9.14 bln
+794.658 mln
9.52%
jan 1, 2002
10.276 bln
+1.136 bln
12.43%
jan 1, 2003
11.212 bln
+935.386 mln
9.1%
jan 1, 2004
11.45 bln
+238.71 mln
2.13%
jan 1, 2005
14.053 bln
+2.603 bln
22.73%
jan 1, 2006
16.33 bln
+2.277 bln
16.2%
jan 1, 2007
18.375 bln
+2.045 bln
12.52%
jan 1, 2008
22.256 bln
+3.881 bln
21.12%
jan 1, 2009
26.133 bln
+3.877 bln
17.42%
jan 1, 2010
24.565 bln
-1.568 bln
-6.0%
jan 1, 2011
25.8 bln
+1.235 bln
5.03%
jan 1, 2012
32.751 bln
+6.95 bln
26.94%
jan 1, 2013
34.19 bln
+1.44 bln
4.4%
jan 1, 2014
34.944 bln
+754.226 mln
2.21%
jan 1, 2015
35.606 bln
+661.289 mln
1.89%
Ranking of countries by current statistics by years


Comments: