29
/
en
AIzaSyAYiBZKx7MnpbEhh9jyipgxe19OcubqV5w
April 1, 2024
220225
Papua New Guinea
PNG
true
2
1
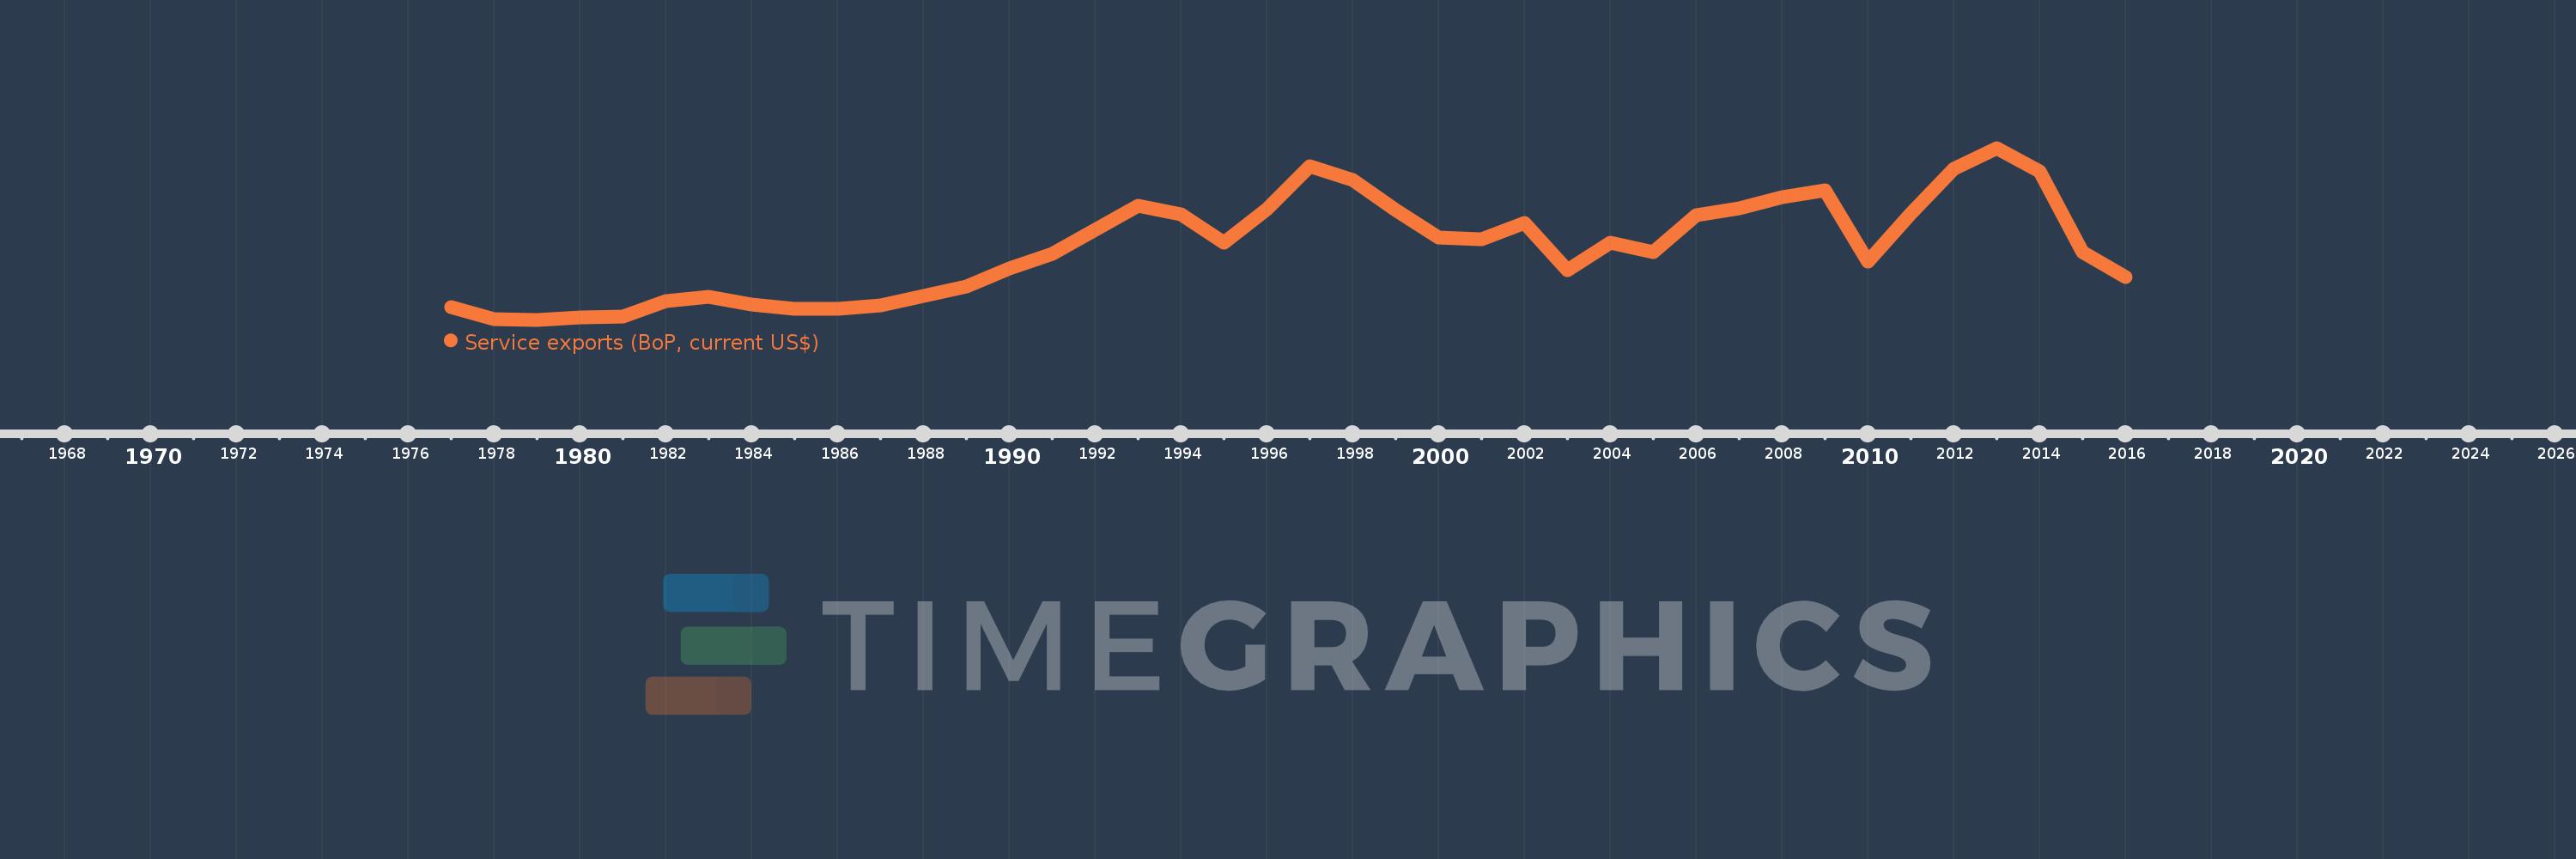
Service exports (BoP, current US$)
2016,2015,2014,2013,2012,2011,2010,2009,2008,2007,2006,2005,2004,2003,2002,2001,2000,1999,1998,1997,1996,1995,1994,1993,1992,1991,1990,1989,1988,1987,1986,1985,1984,1983,1982,1981,1980,1979,1978,1977
This statistics in other country:
AfghanistanAlbaniaAlgeriaAngolaAntigua and BarbudaArab WorldArgentinaArmeniaArubaAustraliaAustriaAzerbaijanBahamas, TheBahrainBangladeshBarbadosBelarusBelgiumBelizeBeninBermudaBhutanBoliviaBosnia and HerzegovinaBotswanaBrazilBrunei DarussalamBulgariaBurkina FasoBurundiCabo VerdeCambodiaCameroonCanadaCaribbean small statesCentral African RepublicCentral Europe and the BalticsChadChileChinaColombiaComorosCongo, Dem. Rep.Congo, Rep.Costa RicaCote d'IvoireCroatiaCuracaoCyprusCzech RepublicDenmarkDjiboutiDominicaDominican RepublicEarly-demographic dividendEast Asia & PacificEast Asia & Pacific (excluding high income)East Asia & Pacific (IDA & IBRD countries)EcuadorEgypt, Arab Rep.El SalvadorEquatorial GuineaEritreaEstoniaEthiopiaEuro areaEurope & Central AsiaEurope & Central Asia (excluding high income)Europe & Central Asia (IDA & IBRD countries)European UnionFaroe IslandsFijiFinlandFragile and conflict affected situationsFranceFrench PolynesiaGabonGambia, TheGeorgiaGermanyGhanaGreeceGrenadaGuatemalaGuineaGuinea-BissauGuyanaHaitiHeavily indebted poor countries (HIPC)High incomeHondurasHong Kong SAR, ChinaHungaryIBRD onlyIcelandIDA & IBRD totalIDA blendIDA onlyIDA totalIndiaIndonesiaIran, Islamic Rep.IraqIrelandIsraelItalyJamaicaJapanJordanKazakhstanKenyaKiribatiKorea, Rep.KosovoKuwaitKyrgyz RepublicLao PDRLate-demographic dividendLatin America & Caribbean Latin America & Caribbean (excluding high income)Latin America & the Caribbean (IDA & IBRD countries)LatviaLeast developed countries: UN classificationLebanonLesothoLiberiaLibyaLithuaniaLow & middle incomeLow incomeLower middle incomeLuxembourgMacao SAR, ChinaMacedonia, FYRMadagascarMalawiMalaysiaMaldivesMaliMaltaMarshall IslandsMauritaniaMauritiusMexicoMicronesia, Fed. Sts.Middle East & North Africa (excluding high income)Middle East & North Africa (IDA & IBRD countries)Middle incomeMoldovaMongoliaMontenegroMoroccoMozambiqueMyanmarNamibiaNepalNetherlandsNew CaledoniaNew ZealandNicaraguaNigerNigeriaNorth AmericaNorwayOECD membersOmanPacific island small statesPakistanPalauPanamaPapua New GuineaParaguayPeruPhilippinesPolandPortugalPost-demographic dividendPre-demographic dividendQatarRomaniaRussian FederationRwandaSamoaSao Tome and PrincipeSaudi ArabiaSenegalSerbiaSeychellesSierra LeoneSingaporeSint Maarten (Dutch part)Slovak RepublicSloveniaSolomon IslandsSouth AfricaSouth AsiaSouth Asia (IDA & IBRD)South SudanSpainSri LankaSt. Kitts and NevisSt. LuciaSt. Vincent and the GrenadinesSub-Saharan Africa Sub-Saharan Africa (excluding high income)Sub-Saharan Africa (IDA & IBRD countries)SudanSurinameSwazilandSwedenSwitzerlandSyrian Arab RepublicTajikistanTanzaniaThailandTimor-LesteTogoTongaTrinidad and TobagoTunisiaTurkeyTuvaluUgandaUkraineUnited KingdomUnited StatesUpper middle incomeUruguayVanuatuVenezuela, RBVietnamWest Bank and GazaWorldYemen, Rep.ZambiaZimbabwe Timeline:
This timeline shows a graph from 1977 to 2016 of Papua New Guinea. No data until 1976. Number of actual observations by date: 40.
Source name:
World Development Indicators
Source organization:
International Monetary Fund, Balance of Payments Statistics Yearbook and data files.
Categories, topics:
Economy & Growth, Trade
Last updated:
apr 23, 2017
Indicators value changes by year
Minimum:
35.655 mln
jan 1, 1979
Maximum:
478.968 mln
jan 1, 2013
At the date of observation
Value
Absolute change
Change from previous value
jan 1, 1977
68.941 mln
+68.941 mln
0.0%
jan 1, 1978
38.034 mln
-30.906 mln
-44.83%
jan 1, 1979
35.655 mln
-2.379 mln
-6.26%
jan 1, 1980
41.839 mln
+6.184 mln
17.35%
jan 1, 1981
43.32 mln
+1.481 mln
3.54%
jan 1, 1982
84.694 mln
+41.374 mln
95.51%
jan 1, 1983
95.404 mln
+10.71 mln
12.65%
jan 1, 1984
75.699 mln
-19.705 mln
-20.65%
jan 1, 1985
64.387 mln
-11.312 mln
-14.94%
jan 1, 1986
64.032 mln
-354.56K
-0.55%
jan 1, 1987
72.475 mln
+8.443 mln
13.19%
jan 1, 1988
97.289 mln
+24.813 mln
34.24%
jan 1, 1989
122.314 mln
+25.025 mln
25.72%
jan 1, 1990
167.895 mln
+45.581 mln
37.27%
jan 1, 1991
205.725 mln
+37.83 mln
22.53%
jan 1, 1992
266.813 mln
+61.087 mln
29.69%
jan 1, 1993
329.198 mln
+62.386 mln
23.38%
jan 1, 1994
306.7 mln
-22.499 mln
-6.83%
jan 1, 1995
235.442 mln
-71.258 mln
-23.23%
jan 1, 1996
321.338 mln
+85.896 mln
36.48%
jan 1, 1997
432.152 mln
+110.813 mln
34.48%
jan 1, 1998
396.926 mln
-35.226 mln
-8.15%
jan 1, 1999
318.034 mln
-78.892 mln
-19.88%
jan 1, 2000
247.534 mln
-70.5 mln
-22.17%
jan 1, 2001
242.662 mln
-4.872 mln
-1.97%
jan 1, 2002
285.127 mln
+42.464 mln
17.5%
jan 1, 2003
163.431 mln
-121.696 mln
-42.68%
jan 1, 2004
235.39 mln
+71.959 mln
44.03%
jan 1, 2005
211.107 mln
-24.283 mln
-10.32%
jan 1, 2006
304.905 mln
+93.798 mln
44.43%
jan 1, 2007
322.468 mln
+17.563 mln
5.76%
jan 1, 2008
352.606 mln
+30.138 mln
9.35%
jan 1, 2009
368.729 mln
+16.122 mln
4.57%
jan 1, 2010
185.399 mln
-183.33 mln
-49.72%
jan 1, 2011
310.411 mln
+125.013 mln
67.43%
jan 1, 2012
424.425 mln
+114.014 mln
36.73%
jan 1, 2013
478.968 mln
+54.542 mln
12.85%
jan 1, 2014
417.597 mln
-61.371 mln
-12.81%
jan 1, 2015
209.394 mln
-208.202 mln
-49.86%
jan 1, 2016
146.221 mln
-63.173 mln
-30.17%
Ranking of countries by current statistics by years


Comments: