29
/
en
AIzaSyAYiBZKx7MnpbEhh9jyipgxe19OcubqV5w
April 1, 2024
33861
European Union
EUU
false
2
1
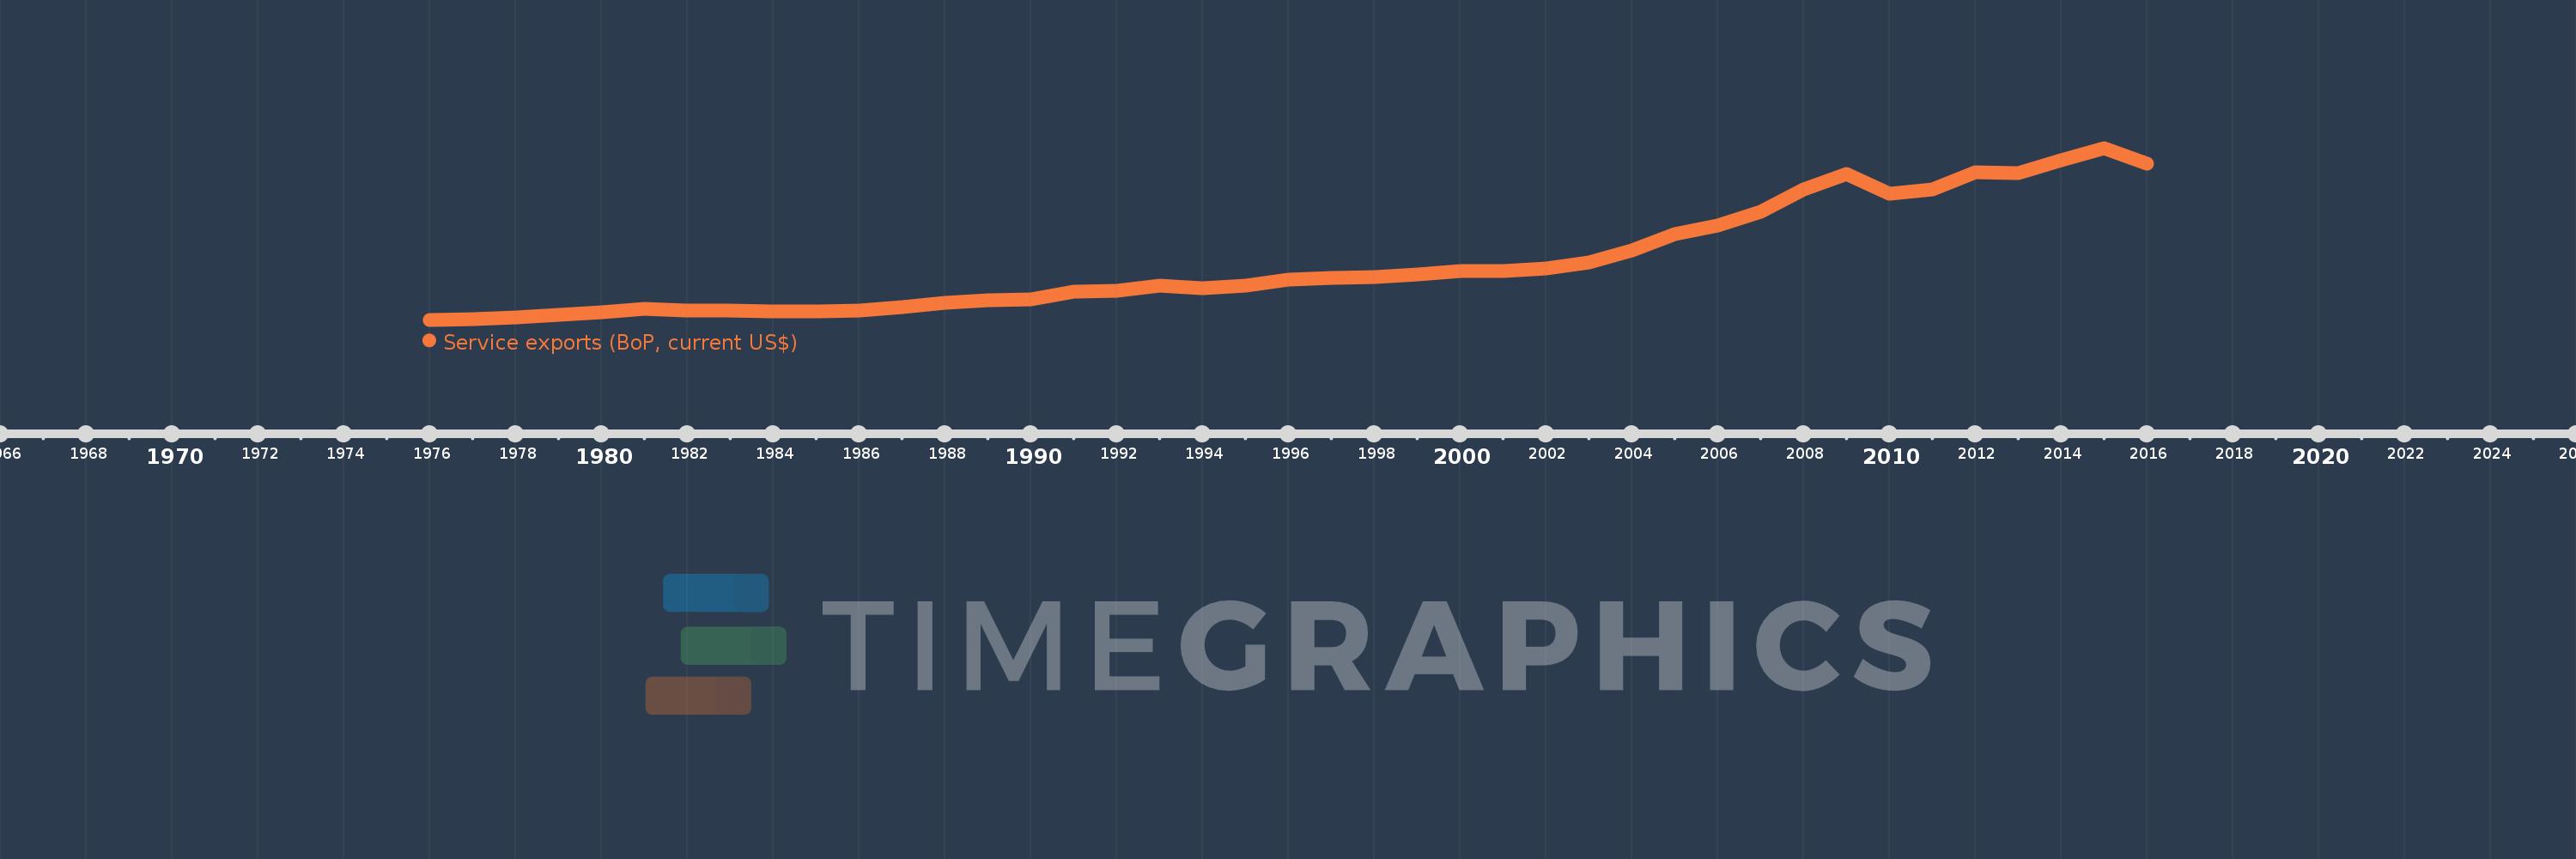
Service exports (BoP, current US$)
2016,2015,2014,2013,2012,2011,2010,2009,2008,2007,2006,2005,2004,2003,2002,2001,2000,1999,1998,1997,1996,1995,1994,1993,1992,1991,1990,1989,1988,1987,1986,1985,1984,1983,1982,1981,1980,1979,1978,1977,1976
This statistics in other country:
AfghanistanAlbaniaAlgeriaAngolaAntigua and BarbudaArab WorldArgentinaArmeniaArubaAustraliaAustriaAzerbaijanBahamas, TheBahrainBangladeshBarbadosBelarusBelgiumBelizeBeninBermudaBhutanBoliviaBosnia and HerzegovinaBotswanaBrazilBrunei DarussalamBulgariaBurkina FasoBurundiCabo VerdeCambodiaCameroonCanadaCaribbean small statesCentral African RepublicCentral Europe and the BalticsChadChileChinaColombiaComorosCongo, Dem. Rep.Congo, Rep.Costa RicaCote d'IvoireCroatiaCuracaoCyprusCzech RepublicDenmarkDjiboutiDominicaDominican RepublicEarly-demographic dividendEast Asia & PacificEast Asia & Pacific (excluding high income)East Asia & Pacific (IDA & IBRD countries)EcuadorEgypt, Arab Rep.El SalvadorEquatorial GuineaEritreaEstoniaEthiopiaEuro areaEurope & Central AsiaEurope & Central Asia (excluding high income)Europe & Central Asia (IDA & IBRD countries)European UnionFaroe IslandsFijiFinlandFragile and conflict affected situationsFranceFrench PolynesiaGabonGambia, TheGeorgiaGermanyGhanaGreeceGrenadaGuatemalaGuineaGuinea-BissauGuyanaHaitiHeavily indebted poor countries (HIPC)High incomeHondurasHong Kong SAR, ChinaHungaryIBRD onlyIcelandIDA & IBRD totalIDA blendIDA onlyIDA totalIndiaIndonesiaIran, Islamic Rep.IraqIrelandIsraelItalyJamaicaJapanJordanKazakhstanKenyaKiribatiKorea, Rep.KosovoKuwaitKyrgyz RepublicLao PDRLate-demographic dividendLatin America & Caribbean Latin America & Caribbean (excluding high income)Latin America & the Caribbean (IDA & IBRD countries)LatviaLeast developed countries: UN classificationLebanonLesothoLiberiaLibyaLithuaniaLow & middle incomeLow incomeLower middle incomeLuxembourgMacao SAR, ChinaMacedonia, FYRMadagascarMalawiMalaysiaMaldivesMaliMaltaMarshall IslandsMauritaniaMauritiusMexicoMicronesia, Fed. Sts.Middle East & North Africa (excluding high income)Middle East & North Africa (IDA & IBRD countries)Middle incomeMoldovaMongoliaMontenegroMoroccoMozambiqueMyanmarNamibiaNepalNetherlandsNew CaledoniaNew ZealandNicaraguaNigerNigeriaNorth AmericaNorwayOECD membersOmanPacific island small statesPakistanPalauPanamaPapua New GuineaParaguayPeruPhilippinesPolandPortugalPost-demographic dividendPre-demographic dividendQatarRomaniaRussian FederationRwandaSamoaSao Tome and PrincipeSaudi ArabiaSenegalSerbiaSeychellesSierra LeoneSingaporeSint Maarten (Dutch part)Slovak RepublicSloveniaSolomon IslandsSouth AfricaSouth AsiaSouth Asia (IDA & IBRD)South SudanSpainSri LankaSt. Kitts and NevisSt. LuciaSt. Vincent and the GrenadinesSub-Saharan Africa Sub-Saharan Africa (excluding high income)Sub-Saharan Africa (IDA & IBRD countries)SudanSurinameSwazilandSwedenSwitzerlandSyrian Arab RepublicTajikistanTanzaniaThailandTimor-LesteTogoTongaTrinidad and TobagoTunisiaTurkeyTuvaluUgandaUkraineUnited KingdomUnited StatesUpper middle incomeUruguayVanuatuVenezuela, RBVietnamWest Bank and GazaWorldYemen, Rep.ZambiaZimbabwe Timeline:
This timeline shows a graph from 1976 to 2016 of European Union. No data until 1975. Number of actual observations by date: 41.
Source name:
World Development Indicators
Source organization:
International Monetary Fund, Balance of Payments Statistics Yearbook and data files.
Categories, topics:
Economy & Growth, Trade
Last updated:
apr 23, 2017
Indicators value changes by year
Minimum:
98.71 bln
jan 1, 1976
Maximum:
2.207 trl
jan 1, 2015
At the date of observation
Value
Absolute change
Change from previous value
jan 1, 1976
98.71 bln
+98.71 bln
0.0%
jan 1, 1977
108.383 bln
+9.673 bln
9.8%
jan 1, 1978
126.428 bln
+18.046 bln
16.65%
jan 1, 1979
157.948 bln
+31.519 bln
24.93%
jan 1, 1980
192.536 bln
+34.588 bln
21.9%
jan 1, 1981
227.356 bln
+34.82 bln
18.08%
jan 1, 1982
213.851 bln
-13.504 bln
-5.94%
jan 1, 1983
206.937 bln
-6.915 bln
-3.23%
jan 1, 1984
198.669 bln
-8.267 bln
-4.0%
jan 1, 1985
196.815 bln
-1.854 bln
-0.93%
jan 1, 1986
207.295 bln
+10.48 bln
5.32%
jan 1, 1987
255.733 bln
+48.438 bln
23.37%
jan 1, 1988
308.577 bln
+52.844 bln
20.66%
jan 1, 1989
333.655 bln
+25.077 bln
8.13%
jan 1, 1990
349.376 bln
+15.721 bln
4.71%
jan 1, 1991
441.315 bln
+91.939 bln
26.32%
jan 1, 1992
449.71 bln
+8.395 bln
1.9%
jan 1, 1993
512.885 bln
+63.174 bln
14.05%
jan 1, 1994
483.151 bln
-29.734 bln
-5.8%
jan 1, 1995
512.295 bln
+29.144 bln
6.03%
jan 1, 1996
586.165 bln
+73.87 bln
14.42%
jan 1, 1997
614.309 bln
+28.144 bln
4.8%
jan 1, 1998
617.773 bln
+3.464 bln
0.56%
jan 1, 1999
658.751 bln
+40.977 bln
6.63%
jan 1, 2000
696.297 bln
+37.546 bln
5.7%
jan 1, 2001
699.671 bln
+3.374 bln
0.48%
jan 1, 2002
724.834 bln
+25.163 bln
3.6%
jan 1, 2003
797.679 bln
+72.845 bln
10.05%
jan 1, 2004
946.395 bln
+148.716 bln
18.64%
jan 1, 2005
1.146 trl
+199.773 bln
21.11%
jan 1, 2006
1.26 trl
+113.786 bln
9.93%
jan 1, 2007
1.42 trl
+160.058 bln
12.7%
jan 1, 2008
1.698 trl
+278.041 bln
19.58%
jan 1, 2009
1.891 trl
+193.331 bln
11.39%
jan 1, 2010
1.649 trl
-241.954 bln
-12.79%
jan 1, 2011
1.694 trl
+44.28 bln
2.68%
jan 1, 2012
1.911 trl
+216.929 bln
12.81%
jan 1, 2013
1.9 trl
-10.729 bln
-0.56%
jan 1, 2014
2.056 trl
+156.278 bln
8.23%
jan 1, 2015
2.207 trl
+150.778 bln
7.33%
jan 1, 2016
2.012 trl
-195.177 bln
-8.84%
Ranking of countries by current statistics by years


Comments: