29
/
en
AIzaSyAYiBZKx7MnpbEhh9jyipgxe19OcubqV5w
April 1, 2024
59361
Sub-Saharan Africa
SSF
false
2
1
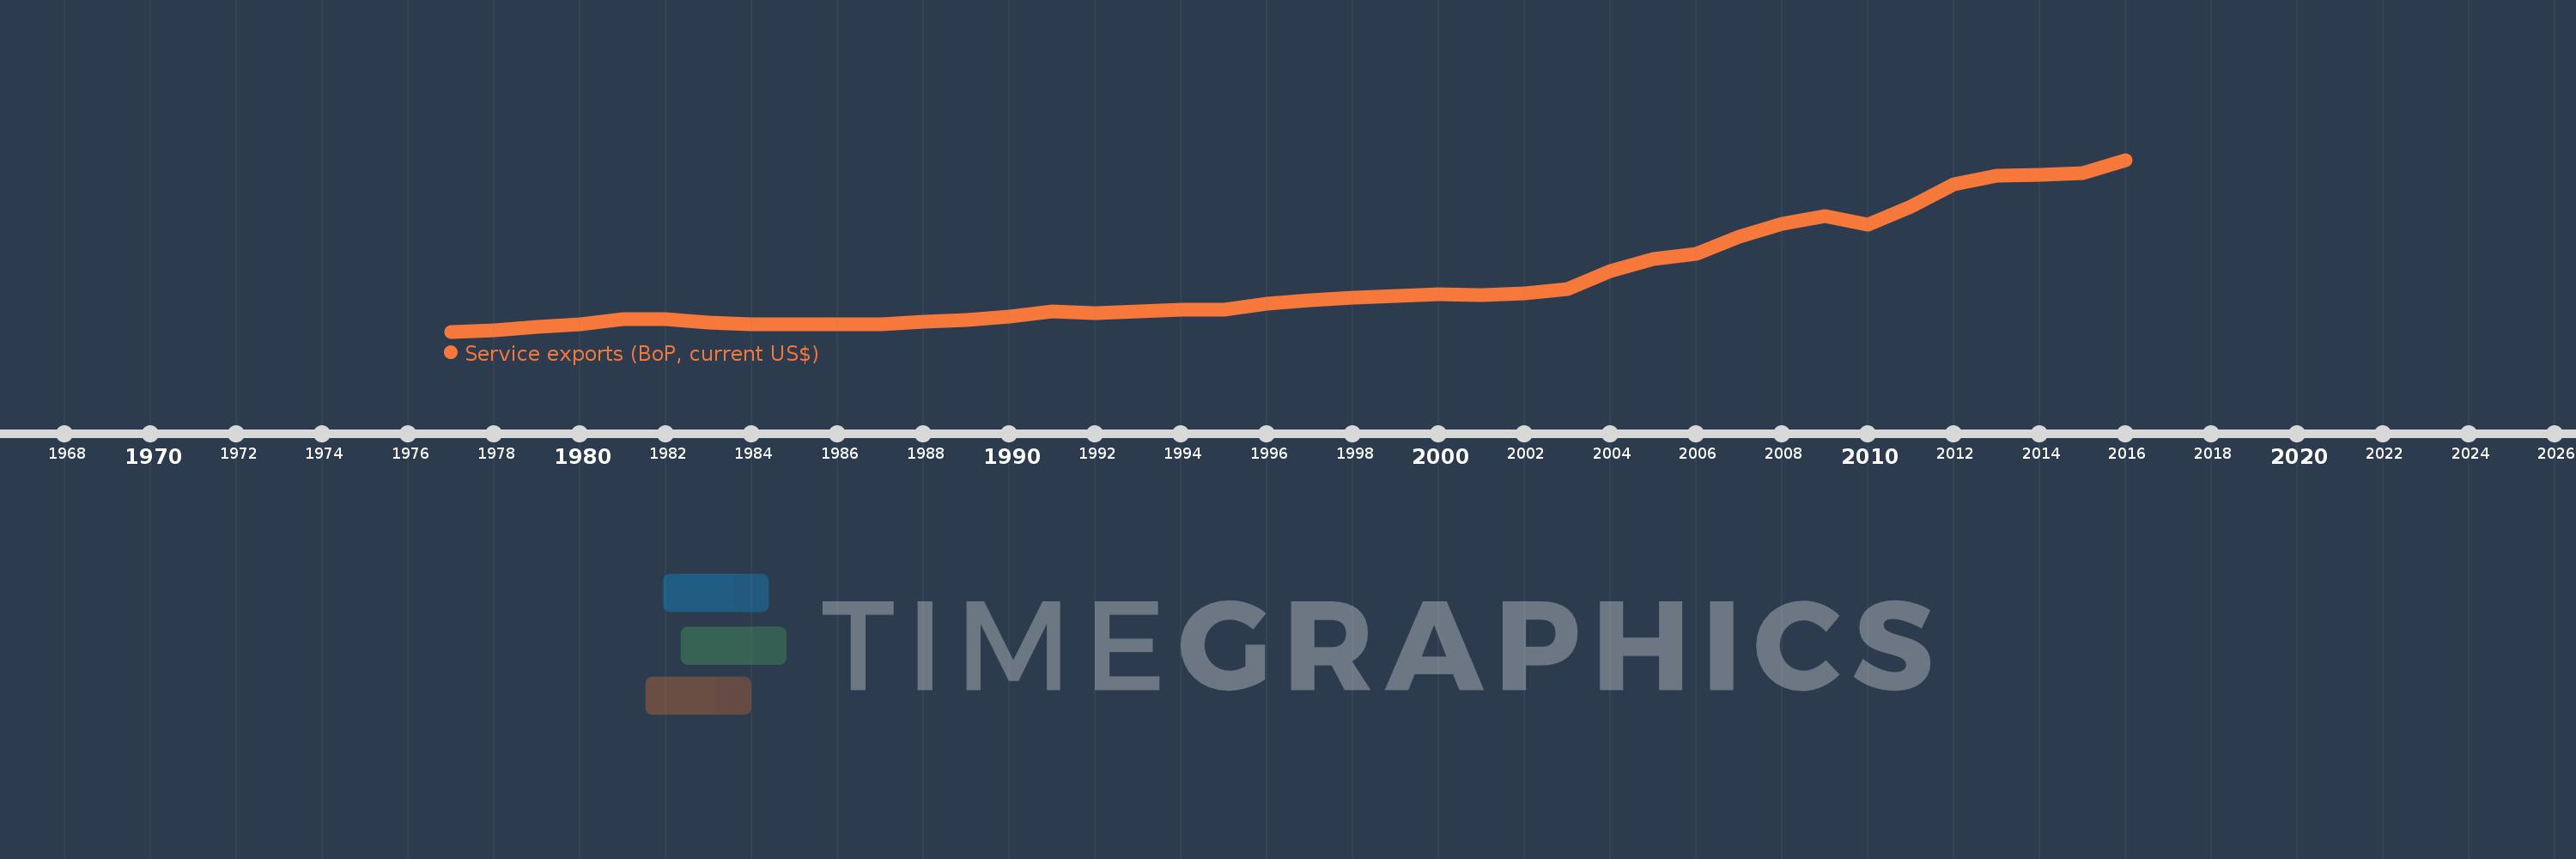
Service exports (BoP, current US$)
2016,2015,2014,2013,2012,2011,2010,2009,2008,2007,2006,2005,2004,2003,2002,2001,2000,1999,1998,1997,1996,1995,1994,1993,1992,1991,1990,1989,1988,1987,1986,1985,1984,1983,1982,1981,1980,1979,1978,1977
This statistics in other country:
AfghanistanAlbaniaAlgeriaAngolaAntigua and BarbudaArab WorldArgentinaArmeniaArubaAustraliaAustriaAzerbaijanBahamas, TheBahrainBangladeshBarbadosBelarusBelgiumBelizeBeninBermudaBhutanBoliviaBosnia and HerzegovinaBotswanaBrazilBrunei DarussalamBulgariaBurkina FasoBurundiCabo VerdeCambodiaCameroonCanadaCaribbean small statesCentral African RepublicCentral Europe and the BalticsChadChileChinaColombiaComorosCongo, Dem. Rep.Congo, Rep.Costa RicaCote d'IvoireCroatiaCuracaoCyprusCzech RepublicDenmarkDjiboutiDominicaDominican RepublicEarly-demographic dividendEast Asia & PacificEast Asia & Pacific (excluding high income)East Asia & Pacific (IDA & IBRD countries)EcuadorEgypt, Arab Rep.El SalvadorEquatorial GuineaEritreaEstoniaEthiopiaEuro areaEurope & Central AsiaEurope & Central Asia (excluding high income)Europe & Central Asia (IDA & IBRD countries)European UnionFaroe IslandsFijiFinlandFragile and conflict affected situationsFranceFrench PolynesiaGabonGambia, TheGeorgiaGermanyGhanaGreeceGrenadaGuatemalaGuineaGuinea-BissauGuyanaHaitiHeavily indebted poor countries (HIPC)High incomeHondurasHong Kong SAR, ChinaHungaryIBRD onlyIcelandIDA & IBRD totalIDA blendIDA onlyIDA totalIndiaIndonesiaIran, Islamic Rep.IraqIrelandIsraelItalyJamaicaJapanJordanKazakhstanKenyaKiribatiKorea, Rep.KosovoKuwaitKyrgyz RepublicLao PDRLate-demographic dividendLatin America & Caribbean Latin America & Caribbean (excluding high income)Latin America & the Caribbean (IDA & IBRD countries)LatviaLeast developed countries: UN classificationLebanonLesothoLiberiaLibyaLithuaniaLow & middle incomeLow incomeLower middle incomeLuxembourgMacao SAR, ChinaMacedonia, FYRMadagascarMalawiMalaysiaMaldivesMaliMaltaMarshall IslandsMauritaniaMauritiusMexicoMicronesia, Fed. Sts.Middle East & North Africa (excluding high income)Middle East & North Africa (IDA & IBRD countries)Middle incomeMoldovaMongoliaMontenegroMoroccoMozambiqueMyanmarNamibiaNepalNetherlandsNew CaledoniaNew ZealandNicaraguaNigerNigeriaNorth AmericaNorwayOECD membersOmanPacific island small statesPakistanPalauPanamaPapua New GuineaParaguayPeruPhilippinesPolandPortugalPost-demographic dividendPre-demographic dividendQatarRomaniaRussian FederationRwandaSamoaSao Tome and PrincipeSaudi ArabiaSenegalSerbiaSeychellesSierra LeoneSingaporeSint Maarten (Dutch part)Slovak RepublicSloveniaSolomon IslandsSouth AfricaSouth AsiaSouth Asia (IDA & IBRD)South SudanSpainSri LankaSt. Kitts and NevisSt. LuciaSt. Vincent and the GrenadinesSub-Saharan Africa Sub-Saharan Africa (excluding high income)Sub-Saharan Africa (IDA & IBRD countries)SudanSurinameSwazilandSwedenSwitzerlandSyrian Arab RepublicTajikistanTanzaniaThailandTimor-LesteTogoTongaTrinidad and TobagoTunisiaTurkeyTuvaluUgandaUkraineUnited KingdomUnited StatesUpper middle incomeUruguayVanuatuVenezuela, RBVietnamWest Bank and GazaWorldYemen, Rep.ZambiaZimbabwe Timeline:
This timeline shows a graph from 1977 to 2016 of Sub-Saharan Africa . No data until 1976. Number of actual observations by date: 40.
Source name:
World Development Indicators
Source organization:
International Monetary Fund, Balance of Payments Statistics Yearbook and data files.
Categories, topics:
Economy & Growth, Trade
Last updated:
apr 23, 2017
Indicators value changes by year
Minimum:
4.268 bln
jan 1, 1977
Maximum:
68.853 bln
jan 1, 2016
At the date of observation
Value
Absolute change
Change from previous value
jan 1, 1977
4.268 bln
+4.268 bln
0.0%
jan 1, 1978
4.72 bln
+451.726 mln
10.58%
jan 1, 1979
5.942 bln
+1.223 bln
25.91%
jan 1, 1980
7.141 bln
+1.199 bln
20.18%
jan 1, 1981
8.821 bln
+1.679 bln
23.52%
jan 1, 1982
8.949 bln
+128.401 mln
1.46%
jan 1, 1983
7.721 bln
-1.228 bln
-13.72%
jan 1, 1984
7.139 bln
-582.666 mln
-7.55%
jan 1, 1985
6.9 bln
-238.483 mln
-3.34%
jan 1, 1986
6.88 bln
-20.355 mln
-0.3%
jan 1, 1987
6.948 bln
+68.366 mln
0.99%
jan 1, 1988
7.913 bln
+965.228 mln
13.89%
jan 1, 1989
8.625 bln
+711.898 mln
9.0%
jan 1, 1990
9.991 bln
+1.366 bln
15.83%
jan 1, 1991
11.734 bln
+1.743 bln
17.45%
jan 1, 1992
11.227 bln
-507.497 mln
-4.33%
jan 1, 1993
12.008 bln
+781.824 mln
6.96%
jan 1, 1994
12.529 bln
+520.894 mln
4.34%
jan 1, 1995
12.572 bln
+42.678 mln
0.34%
jan 1, 1996
14.834 bln
+2.263 bln
18.0%
jan 1, 1997
15.994 bln
+1.16 bln
7.82%
jan 1, 1998
16.88 bln
+885.726 mln
5.54%
jan 1, 1999
17.707 bln
+826.974 mln
4.9%
jan 1, 2000
18.351 bln
+643.655 mln
3.64%
jan 1, 2001
17.866 bln
-485.12 mln
-2.64%
jan 1, 2002
18.593 bln
+727.527 mln
4.07%
jan 1, 2003
20.392 bln
+1.799 bln
9.68%
jan 1, 2004
26.951 bln
+6.559 bln
32.16%
jan 1, 2005
31.483 bln
+4.532 bln
16.82%
jan 1, 2006
33.608 bln
+2.124 bln
6.75%
jan 1, 2007
39.838 bln
+6.231 bln
18.54%
jan 1, 2008
44.67 bln
+4.831 bln
12.13%
jan 1, 2009
47.852 bln
+3.183 bln
7.13%
jan 1, 2010
44.453 bln
-3.399 bln
-7.1%
jan 1, 2011
51.296 bln
+6.843 bln
15.39%
jan 1, 2012
59.77 bln
+8.473 bln
16.52%
jan 1, 2013
62.989 bln
+3.219 bln
5.39%
jan 1, 2014
63.24 bln
+251.063 mln
0.4%
jan 1, 2015
63.744 bln
+504.652 mln
0.8%
jan 1, 2016
68.853 bln
+5.109 bln
8.01%
Ranking of countries by current statistics by years


Comments: