29
/
en
AIzaSyAYiBZKx7MnpbEhh9jyipgxe19OcubqV5w
April 1, 2024
54433
Pacific island small states
PSS
false
2
1
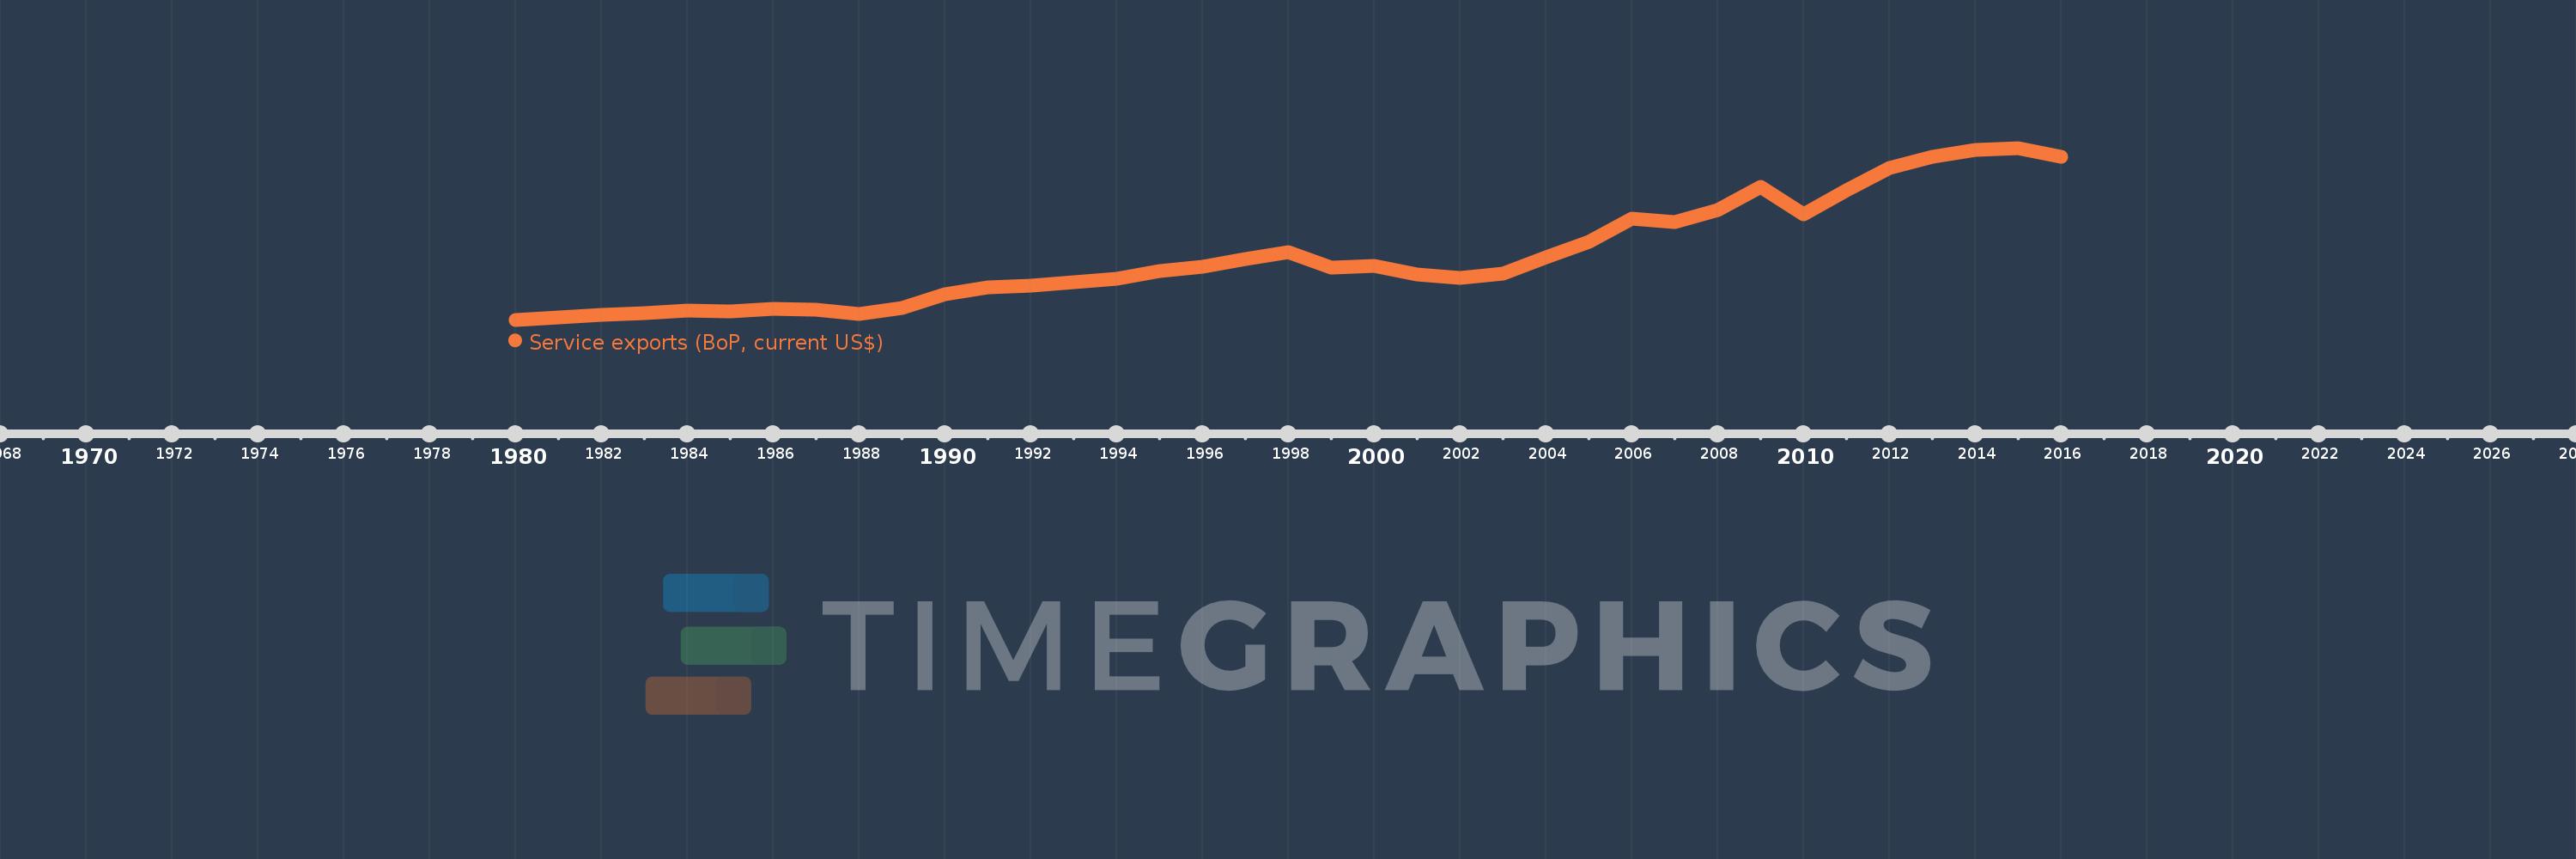
Service exports (BoP, current US$)
2016,2015,2014,2013,2012,2011,2010,2009,2008,2007,2006,2005,2004,2003,2002,2001,2000,1999,1998,1997,1996,1995,1994,1993,1992,1991,1990,1989,1988,1987,1986,1985,1984,1983,1982,1981,1980
This statistics in other country:
AfghanistanAlbaniaAlgeriaAngolaAntigua and BarbudaArab WorldArgentinaArmeniaArubaAustraliaAustriaAzerbaijanBahamas, TheBahrainBangladeshBarbadosBelarusBelgiumBelizeBeninBermudaBhutanBoliviaBosnia and HerzegovinaBotswanaBrazilBrunei DarussalamBulgariaBurkina FasoBurundiCabo VerdeCambodiaCameroonCanadaCaribbean small statesCentral African RepublicCentral Europe and the BalticsChadChileChinaColombiaComorosCongo, Dem. Rep.Congo, Rep.Costa RicaCote d'IvoireCroatiaCuracaoCyprusCzech RepublicDenmarkDjiboutiDominicaDominican RepublicEarly-demographic dividendEast Asia & PacificEast Asia & Pacific (excluding high income)East Asia & Pacific (IDA & IBRD countries)EcuadorEgypt, Arab Rep.El SalvadorEquatorial GuineaEritreaEstoniaEthiopiaEuro areaEurope & Central AsiaEurope & Central Asia (excluding high income)Europe & Central Asia (IDA & IBRD countries)European UnionFaroe IslandsFijiFinlandFragile and conflict affected situationsFranceFrench PolynesiaGabonGambia, TheGeorgiaGermanyGhanaGreeceGrenadaGuatemalaGuineaGuinea-BissauGuyanaHaitiHeavily indebted poor countries (HIPC)High incomeHondurasHong Kong SAR, ChinaHungaryIBRD onlyIcelandIDA & IBRD totalIDA blendIDA onlyIDA totalIndiaIndonesiaIran, Islamic Rep.IraqIrelandIsraelItalyJamaicaJapanJordanKazakhstanKenyaKiribatiKorea, Rep.KosovoKuwaitKyrgyz RepublicLao PDRLate-demographic dividendLatin America & Caribbean Latin America & Caribbean (excluding high income)Latin America & the Caribbean (IDA & IBRD countries)LatviaLeast developed countries: UN classificationLebanonLesothoLiberiaLibyaLithuaniaLow & middle incomeLow incomeLower middle incomeLuxembourgMacao SAR, ChinaMacedonia, FYRMadagascarMalawiMalaysiaMaldivesMaliMaltaMarshall IslandsMauritaniaMauritiusMexicoMicronesia, Fed. Sts.Middle East & North Africa (excluding high income)Middle East & North Africa (IDA & IBRD countries)Middle incomeMoldovaMongoliaMontenegroMoroccoMozambiqueMyanmarNamibiaNepalNetherlandsNew CaledoniaNew ZealandNicaraguaNigerNigeriaNorth AmericaNorwayOECD membersOmanPacific island small statesPakistanPalauPanamaPapua New GuineaParaguayPeruPhilippinesPolandPortugalPost-demographic dividendPre-demographic dividendQatarRomaniaRussian FederationRwandaSamoaSao Tome and PrincipeSaudi ArabiaSenegalSerbiaSeychellesSierra LeoneSingaporeSint Maarten (Dutch part)Slovak RepublicSloveniaSolomon IslandsSouth AfricaSouth AsiaSouth Asia (IDA & IBRD)South SudanSpainSri LankaSt. Kitts and NevisSt. LuciaSt. Vincent and the GrenadinesSub-Saharan Africa Sub-Saharan Africa (excluding high income)Sub-Saharan Africa (IDA & IBRD countries)SudanSurinameSwazilandSwedenSwitzerlandSyrian Arab RepublicTajikistanTanzaniaThailandTimor-LesteTogoTongaTrinidad and TobagoTunisiaTurkeyTuvaluUgandaUkraineUnited KingdomUnited StatesUpper middle incomeUruguayVanuatuVenezuela, RBVietnamWest Bank and GazaWorldYemen, Rep.ZambiaZimbabwe Timeline:
This timeline shows a graph from 1980 to 2016 of Pacific island small states. No data until 1979. Number of actual observations by date: 37.
Source name:
World Development Indicators
Source organization:
International Monetary Fund, Balance of Payments Statistics Yearbook and data files.
Categories, topics:
Economy & Growth, Trade
Last updated:
apr 23, 2017
Indicators value changes by year
Minimum:
262.125 mln
jan 1, 1980
Maximum:
2.214 bln
jan 1, 2015
At the date of observation
Value
Absolute change
Change from previous value
jan 1, 1980
262.125 mln
+262.125 mln
0.0%
jan 1, 1981
293.349 mln
+31.224 mln
11.91%
jan 1, 1982
320.315 mln
+26.966 mln
9.19%
jan 1, 1983
341.762 mln
+21.447 mln
6.7%
jan 1, 1984
362.717 mln
+20.955 mln
6.13%
jan 1, 1985
360.87 mln
-1.847 mln
-0.51%
jan 1, 1986
388.11 mln
+27.239 mln
7.55%
jan 1, 1987
380.515 mln
-7.595 mln
-1.96%
jan 1, 1988
331.334 mln
-49.181 mln
-12.92%
jan 1, 1989
393.994 mln
+62.659 mln
18.91%
jan 1, 1990
548.435 mln
+154.442 mln
39.2%
jan 1, 1991
632.46 mln
+84.025 mln
15.32%
jan 1, 1992
651.036 mln
+18.576 mln
2.94%
jan 1, 1993
692.209 mln
+41.173 mln
6.32%
jan 1, 1994
728.035 mln
+35.826 mln
5.18%
jan 1, 1995
819.209 mln
+91.174 mln
12.52%
jan 1, 1996
862.753 mln
+43.544 mln
5.32%
jan 1, 1997
956.002 mln
+93.249 mln
10.81%
jan 1, 1998
1.035 bln
+78.645 mln
8.23%
jan 1, 1999
852.943 mln
-181.704 mln
-17.56%
jan 1, 2000
874.412 mln
+21.469 mln
2.52%
jan 1, 2001
778.914 mln
-95.498 mln
-10.92%
jan 1, 2002
739.536 mln
-39.378 mln
-5.06%
jan 1, 2003
789.796 mln
+50.26 mln
6.8%
jan 1, 2004
973.823 mln
+184.027 mln
23.3%
jan 1, 2005
1.149 bln
+175.53 mln
18.02%
jan 1, 2006
1.408 bln
+258.157 mln
22.46%
jan 1, 2007
1.374 bln
-33.816 mln
-2.4%
jan 1, 2008
1.509 bln
+134.813 mln
9.81%
jan 1, 2009
1.767 bln
+258.744 mln
17.15%
jan 1, 2010
1.462 bln
-305.682 mln
-17.3%
jan 1, 2011
1.731 bln
+269.921 mln
18.47%
jan 1, 2012
1.988 bln
+256.082 mln
14.79%
jan 1, 2013
2.112 bln
+124.054 mln
6.24%
jan 1, 2014
2.193 bln
+81.866 mln
3.88%
jan 1, 2015
2.214 bln
+20.267 mln
0.92%
jan 1, 2016
2.111 bln
-103.017 mln
-4.65%
Ranking of countries by current statistics by years


Comments: