29
/
en
AIzaSyAYiBZKx7MnpbEhh9jyipgxe19OcubqV5w
April 1, 2024
83469
Belize
BLZ
true
2
1
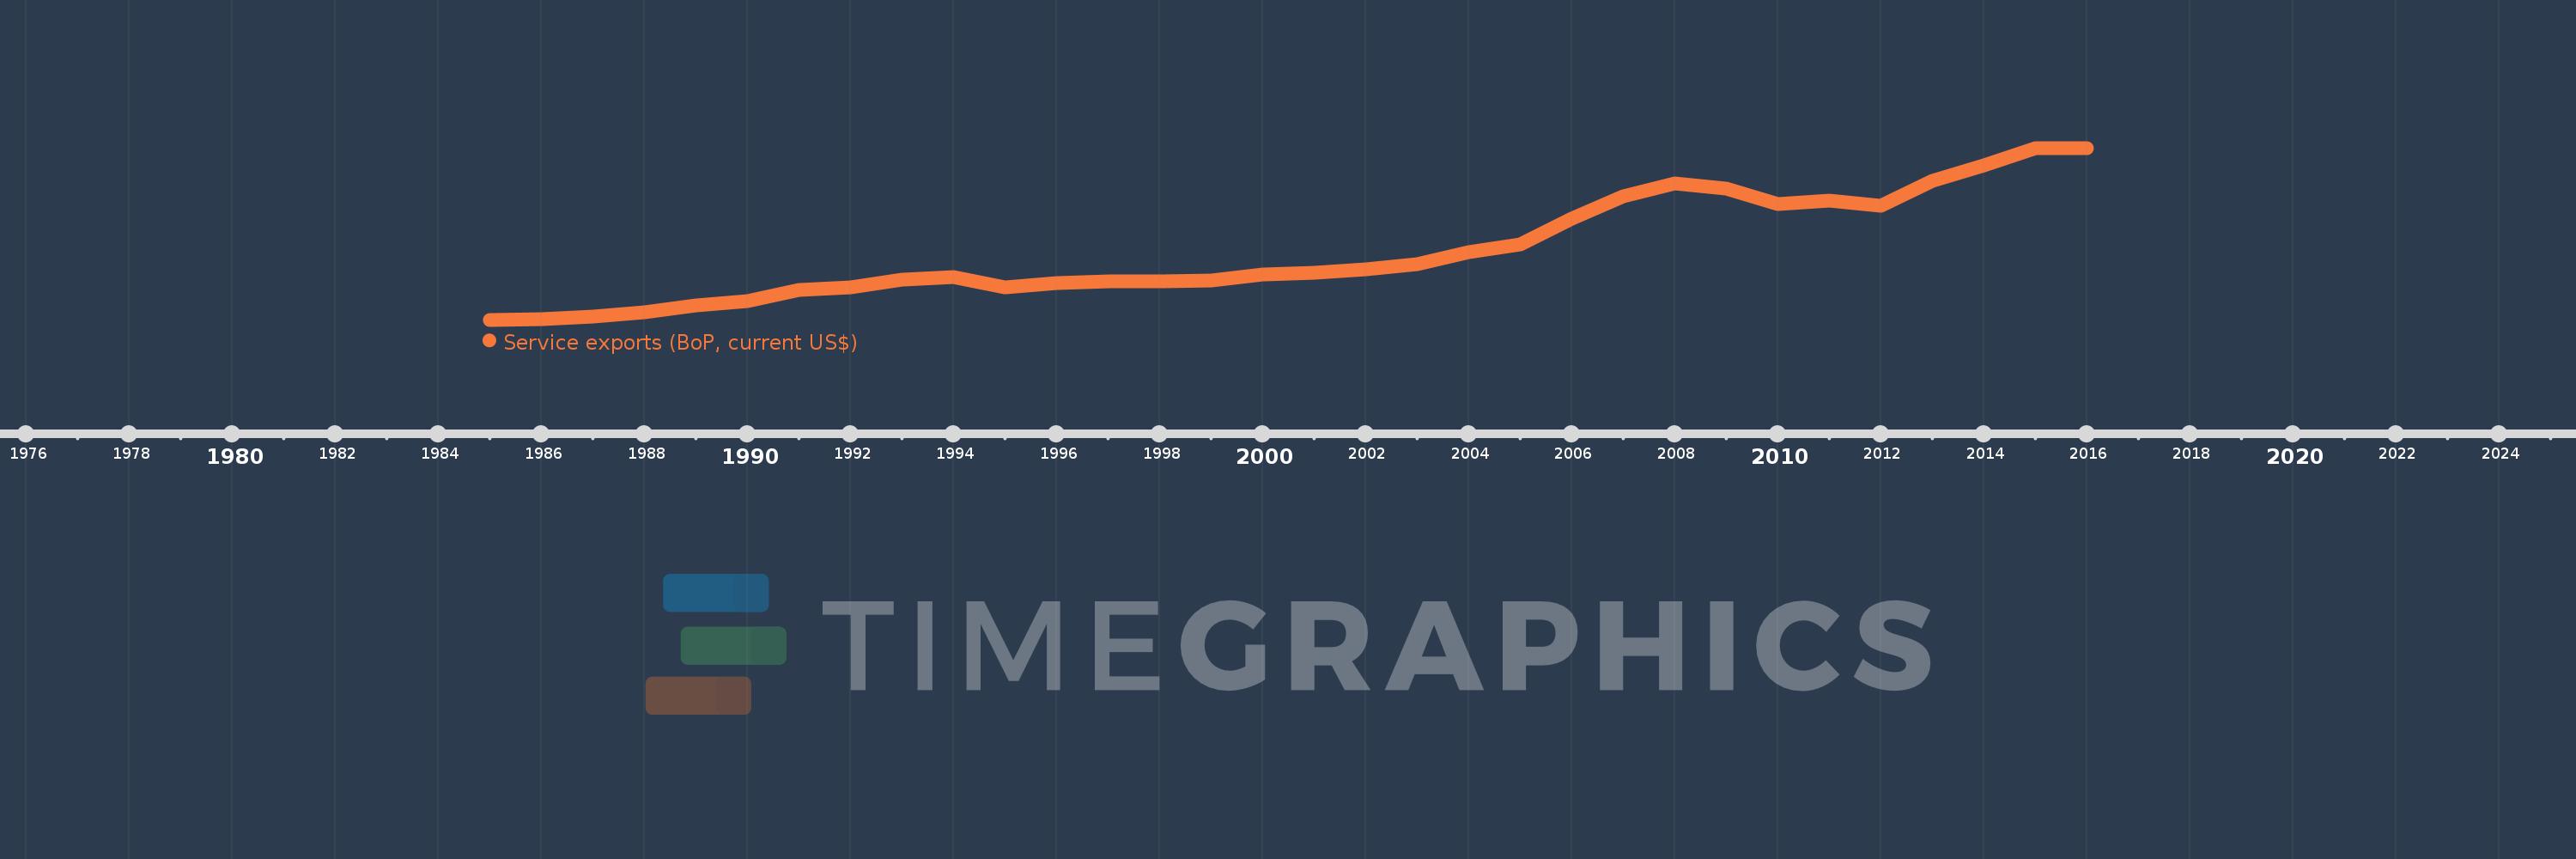
Service exports (BoP, current US$)
2016,2015,2014,2013,2012,2011,2010,2009,2008,2007,2006,2005,2004,2003,2002,2001,2000,1999,1998,1997,1996,1995,1994,1993,1992,1991,1990,1989,1988,1987,1986,1985
This statistics in other country:
AfghanistanAlbaniaAlgeriaAngolaAntigua and BarbudaArab WorldArgentinaArmeniaArubaAustraliaAustriaAzerbaijanBahamas, TheBahrainBangladeshBarbadosBelarusBelgiumBelizeBeninBermudaBhutanBoliviaBosnia and HerzegovinaBotswanaBrazilBrunei DarussalamBulgariaBurkina FasoBurundiCabo VerdeCambodiaCameroonCanadaCaribbean small statesCentral African RepublicCentral Europe and the BalticsChadChileChinaColombiaComorosCongo, Dem. Rep.Congo, Rep.Costa RicaCote d'IvoireCroatiaCuracaoCyprusCzech RepublicDenmarkDjiboutiDominicaDominican RepublicEarly-demographic dividendEast Asia & PacificEast Asia & Pacific (excluding high income)East Asia & Pacific (IDA & IBRD countries)EcuadorEgypt, Arab Rep.El SalvadorEquatorial GuineaEritreaEstoniaEthiopiaEuro areaEurope & Central AsiaEurope & Central Asia (excluding high income)Europe & Central Asia (IDA & IBRD countries)European UnionFaroe IslandsFijiFinlandFragile and conflict affected situationsFranceFrench PolynesiaGabonGambia, TheGeorgiaGermanyGhanaGreeceGrenadaGuatemalaGuineaGuinea-BissauGuyanaHaitiHeavily indebted poor countries (HIPC)High incomeHondurasHong Kong SAR, ChinaHungaryIBRD onlyIcelandIDA & IBRD totalIDA blendIDA onlyIDA totalIndiaIndonesiaIran, Islamic Rep.IraqIrelandIsraelItalyJamaicaJapanJordanKazakhstanKenyaKiribatiKorea, Rep.KosovoKuwaitKyrgyz RepublicLao PDRLate-demographic dividendLatin America & Caribbean Latin America & Caribbean (excluding high income)Latin America & the Caribbean (IDA & IBRD countries)LatviaLeast developed countries: UN classificationLebanonLesothoLiberiaLibyaLithuaniaLow & middle incomeLow incomeLower middle incomeLuxembourgMacao SAR, ChinaMacedonia, FYRMadagascarMalawiMalaysiaMaldivesMaliMaltaMarshall IslandsMauritaniaMauritiusMexicoMicronesia, Fed. Sts.Middle East & North Africa (excluding high income)Middle East & North Africa (IDA & IBRD countries)Middle incomeMoldovaMongoliaMontenegroMoroccoMozambiqueMyanmarNamibiaNepalNetherlandsNew CaledoniaNew ZealandNicaraguaNigerNigeriaNorth AmericaNorwayOECD membersOmanPacific island small statesPakistanPalauPanamaPapua New GuineaParaguayPeruPhilippinesPolandPortugalPost-demographic dividendPre-demographic dividendQatarRomaniaRussian FederationRwandaSamoaSao Tome and PrincipeSaudi ArabiaSenegalSerbiaSeychellesSierra LeoneSingaporeSint Maarten (Dutch part)Slovak RepublicSloveniaSolomon IslandsSouth AfricaSouth AsiaSouth Asia (IDA & IBRD)South SudanSpainSri LankaSt. Kitts and NevisSt. LuciaSt. Vincent and the GrenadinesSub-Saharan Africa Sub-Saharan Africa (excluding high income)Sub-Saharan Africa (IDA & IBRD countries)SudanSurinameSwazilandSwedenSwitzerlandSyrian Arab RepublicTajikistanTanzaniaThailandTimor-LesteTogoTongaTrinidad and TobagoTunisiaTurkeyTuvaluUgandaUkraineUnited KingdomUnited StatesUpper middle incomeUruguayVanuatuVenezuela, RBVietnamWest Bank and GazaWorldYemen, Rep.ZambiaZimbabwe Timeline:
This timeline shows a graph from 1985 to 2016 of Belize. No data until 1984. Number of actual observations by date: 32.
Source name:
World Development Indicators
Source organization:
International Monetary Fund, Balance of Payments Statistics Yearbook and data files.
Categories, topics:
Economy & Growth, Trade
Last updated:
apr 23, 2017
Indicators value changes by year
Minimum:
35.4 mln
jan 1, 1985
Maximum:
495.733 mln
jan 1, 2016
At the date of observation
Value
Absolute change
Change from previous value
jan 1, 1985
35.4 mln
+35.4 mln
0.0%
jan 1, 1986
38.1 mln
+2.7 mln
7.63%
jan 1, 1987
42.8 mln
+4.7 mln
12.34%
jan 1, 1988
55.95 mln
+13.15 mln
30.72%
jan 1, 1989
74.45 mln
+18.5 mln
33.07%
jan 1, 1990
85.85 mln
+11.4 mln
15.31%
jan 1, 1991
115.35 mln
+29.5 mln
34.36%
jan 1, 1992
122.7 mln
+7.35 mln
6.37%
jan 1, 1993
142.6 mln
+19.9 mln
16.22%
jan 1, 1994
150.5 mln
+7.9 mln
5.54%
jan 1, 1995
121.147 mln
-29.353 mln
-19.5%
jan 1, 1996
132.806 mln
+11.659 mln
9.62%
jan 1, 1997
137.875 mln
+5.069 mln
3.82%
jan 1, 1998
137.84 mln
-35.0K
-0.03%
jan 1, 1999
140.45 mln
+2.61 mln
1.89%
jan 1, 2000
157.55 mln
+17.1 mln
12.18%
jan 1, 2001
161.779 mln
+4.229 mln
2.68%
jan 1, 2002
171.412 mln
+9.633 mln
5.95%
jan 1, 2003
184.243 mln
+12.831 mln
7.49%
jan 1, 2004
215.545 mln
+31.303 mln
16.99%
jan 1, 2005
238.14 mln
+22.595 mln
10.48%
jan 1, 2006
306.952 mln
+68.812 mln
28.9%
jan 1, 2007
367.036 mln
+60.084 mln
19.57%
jan 1, 2008
400.087 mln
+33.05 mln
9.0%
jan 1, 2009
386.592 mln
-13.494 mln
-3.37%
jan 1, 2010
344.344 mln
-42.248 mln
-10.93%
jan 1, 2011
353.846 mln
+9.502 mln
2.76%
jan 1, 2012
340.186 mln
-13.661 mln
-3.86%
jan 1, 2013
406.56 mln
+66.374 mln
19.51%
jan 1, 2014
448.053 mln
+41.493 mln
10.21%
jan 1, 2015
494.314 mln
+46.261 mln
10.32%
jan 1, 2016
495.733 mln
+1.418 mln
0.29%
Ranking of countries by current statistics by years


Comments: