29
/
en
AIzaSyAYiBZKx7MnpbEhh9jyipgxe19OcubqV5w
April 1, 2024
119387
Denmark
DNK
true
2
1
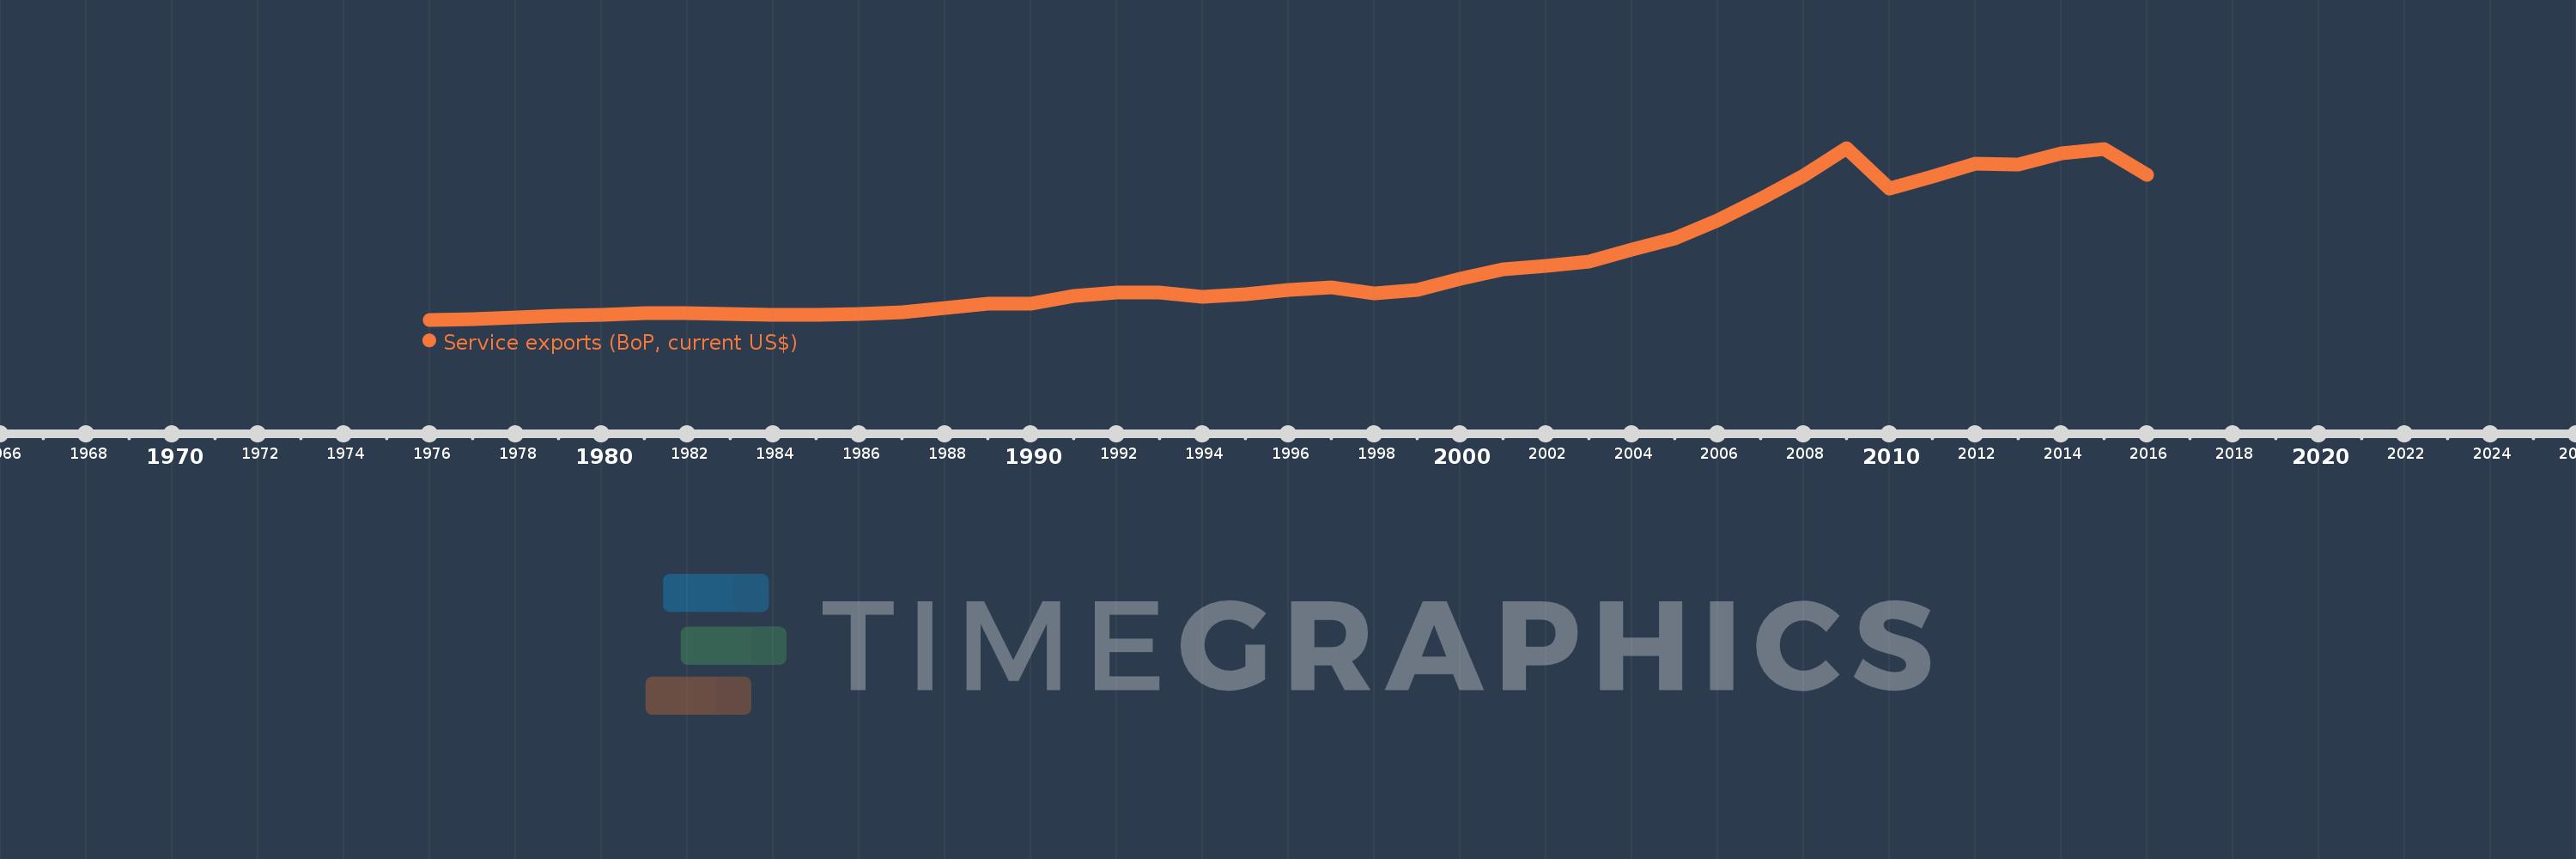
Service exports (BoP, current US$)
2016,2015,2014,2013,2012,2011,2010,2009,2008,2007,2006,2005,2004,2003,2002,2001,2000,1999,1998,1997,1996,1995,1994,1993,1992,1991,1990,1989,1988,1987,1986,1985,1984,1983,1982,1981,1980,1979,1978,1977,1976
This statistics in other country:
AfghanistanAlbaniaAlgeriaAngolaAntigua and BarbudaArab WorldArgentinaArmeniaArubaAustraliaAustriaAzerbaijanBahamas, TheBahrainBangladeshBarbadosBelarusBelgiumBelizeBeninBermudaBhutanBoliviaBosnia and HerzegovinaBotswanaBrazilBrunei DarussalamBulgariaBurkina FasoBurundiCabo VerdeCambodiaCameroonCanadaCaribbean small statesCentral African RepublicCentral Europe and the BalticsChadChileChinaColombiaComorosCongo, Dem. Rep.Congo, Rep.Costa RicaCote d'IvoireCroatiaCuracaoCyprusCzech RepublicDenmarkDjiboutiDominicaDominican RepublicEarly-demographic dividendEast Asia & PacificEast Asia & Pacific (excluding high income)East Asia & Pacific (IDA & IBRD countries)EcuadorEgypt, Arab Rep.El SalvadorEquatorial GuineaEritreaEstoniaEthiopiaEuro areaEurope & Central AsiaEurope & Central Asia (excluding high income)Europe & Central Asia (IDA & IBRD countries)European UnionFaroe IslandsFijiFinlandFragile and conflict affected situationsFranceFrench PolynesiaGabonGambia, TheGeorgiaGermanyGhanaGreeceGrenadaGuatemalaGuineaGuinea-BissauGuyanaHaitiHeavily indebted poor countries (HIPC)High incomeHondurasHong Kong SAR, ChinaHungaryIBRD onlyIcelandIDA & IBRD totalIDA blendIDA onlyIDA totalIndiaIndonesiaIran, Islamic Rep.IraqIrelandIsraelItalyJamaicaJapanJordanKazakhstanKenyaKiribatiKorea, Rep.KosovoKuwaitKyrgyz RepublicLao PDRLate-demographic dividendLatin America & Caribbean Latin America & Caribbean (excluding high income)Latin America & the Caribbean (IDA & IBRD countries)LatviaLeast developed countries: UN classificationLebanonLesothoLiberiaLibyaLithuaniaLow & middle incomeLow incomeLower middle incomeLuxembourgMacao SAR, ChinaMacedonia, FYRMadagascarMalawiMalaysiaMaldivesMaliMaltaMarshall IslandsMauritaniaMauritiusMexicoMicronesia, Fed. Sts.Middle East & North Africa (excluding high income)Middle East & North Africa (IDA & IBRD countries)Middle incomeMoldovaMongoliaMontenegroMoroccoMozambiqueMyanmarNamibiaNepalNetherlandsNew CaledoniaNew ZealandNicaraguaNigerNigeriaNorth AmericaNorwayOECD membersOmanPacific island small statesPakistanPalauPanamaPapua New GuineaParaguayPeruPhilippinesPolandPortugalPost-demographic dividendPre-demographic dividendQatarRomaniaRussian FederationRwandaSamoaSao Tome and PrincipeSaudi ArabiaSenegalSerbiaSeychellesSierra LeoneSingaporeSint Maarten (Dutch part)Slovak RepublicSloveniaSolomon IslandsSouth AfricaSouth AsiaSouth Asia (IDA & IBRD)South SudanSpainSri LankaSt. Kitts and NevisSt. LuciaSt. Vincent and the GrenadinesSub-Saharan Africa Sub-Saharan Africa (excluding high income)Sub-Saharan Africa (IDA & IBRD countries)SudanSurinameSwazilandSwedenSwitzerlandSyrian Arab RepublicTajikistanTanzaniaThailandTimor-LesteTogoTongaTrinidad and TobagoTunisiaTurkeyTuvaluUgandaUkraineUnited KingdomUnited StatesUpper middle incomeUruguayVanuatuVenezuela, RBVietnamWest Bank and GazaWorldYemen, Rep.ZambiaZimbabwe Timeline:
This timeline shows a graph from 1976 to 2016 of Denmark. No data until 1975. Number of actual observations by date: 41.
Source name:
World Development Indicators
Source organization:
International Monetary Fund, Balance of Payments Statistics Yearbook and data files.
Categories, topics:
Economy & Growth, Trade
Last updated:
apr 23, 2017
Indicators value changes by year
Minimum:
3.223 bln
jan 1, 1976
Maximum:
72.778 bln
jan 1, 2009
At the date of observation
Value
Absolute change
Change from previous value
jan 1, 1976
3.223 bln
+3.223 bln
0.0%
jan 1, 1977
3.586 bln
+363.337 mln
11.27%
jan 1, 1978
4.113 bln
+527.008 mln
14.69%
jan 1, 1979
4.785 bln
+671.704 mln
16.33%
jan 1, 1980
5.299 bln
+513.627 mln
10.73%
jan 1, 1981
5.862 bln
+563.576 mln
10.64%
jan 1, 1982
5.853 bln
-9.613 mln
-0.16%
jan 1, 1983
5.41 bln
-442.268 mln
-7.56%
jan 1, 1984
5.131 bln
-279.345 mln
-5.16%
jan 1, 1985
5.049 bln
-82.017 mln
-1.6%
jan 1, 1986
5.487 bln
+437.799 mln
8.67%
jan 1, 1987
6.372 bln
+885.424 mln
16.14%
jan 1, 1988
7.848 bln
+1.476 bln
23.16%
jan 1, 1989
9.623 bln
+1.774 bln
22.61%
jan 1, 1990
9.57 bln
-52.712 mln
-0.55%
jan 1, 1991
12.83 bln
+3.26 bln
34.06%
jan 1, 1992
14.264 bln
+1.435 bln
11.18%
jan 1, 1993
14.083 bln
-181.514 mln
-1.27%
jan 1, 1994
12.564 bln
-1.519 bln
-10.79%
jan 1, 1995
13.661 bln
+1.098 bln
8.74%
jan 1, 1996
15.307 bln
+1.646 bln
12.05%
jan 1, 1997
16.502 bln
+1.195 bln
7.81%
jan 1, 1998
14.044 bln
-2.458 bln
-14.9%
jan 1, 1999
15.212 bln
+1.168 bln
8.32%
jan 1, 2000
19.982 bln
+4.77 bln
31.36%
jan 1, 2001
23.721 bln
+3.74 bln
18.72%
jan 1, 2002
25.134 bln
+1.413 bln
5.96%
jan 1, 2003
26.667 bln
+1.532 bln
6.1%
jan 1, 2004
31.672 bln
+5.006 bln
18.77%
jan 1, 2005
36.304 bln
+4.632 bln
14.62%
jan 1, 2006
43.371 bln
+7.067 bln
19.47%
jan 1, 2007
52.308 bln
+8.936 bln
20.6%
jan 1, 2008
61.594 bln
+9.287 bln
17.75%
jan 1, 2009
72.778 bln
+11.184 bln
18.16%
jan 1, 2010
56.243 bln
-16.535 bln
-22.72%
jan 1, 2011
61.211 bln
+4.968 bln
8.83%
jan 1, 2012
66.494 bln
+5.283 bln
8.63%
jan 1, 2013
65.999 bln
-495.141 mln
-0.74%
jan 1, 2014
70.686 bln
+4.687 bln
7.1%
jan 1, 2015
72.468 bln
+1.782 bln
2.52%
jan 1, 2016
61.794 bln
-10.674 bln
-14.73%
Ranking of countries by current statistics by years


Comments: