29
/
en
AIzaSyAYiBZKx7MnpbEhh9jyipgxe19OcubqV5w
April 1, 2024
41916
Latin America & Caribbean
LCN
false
2
1
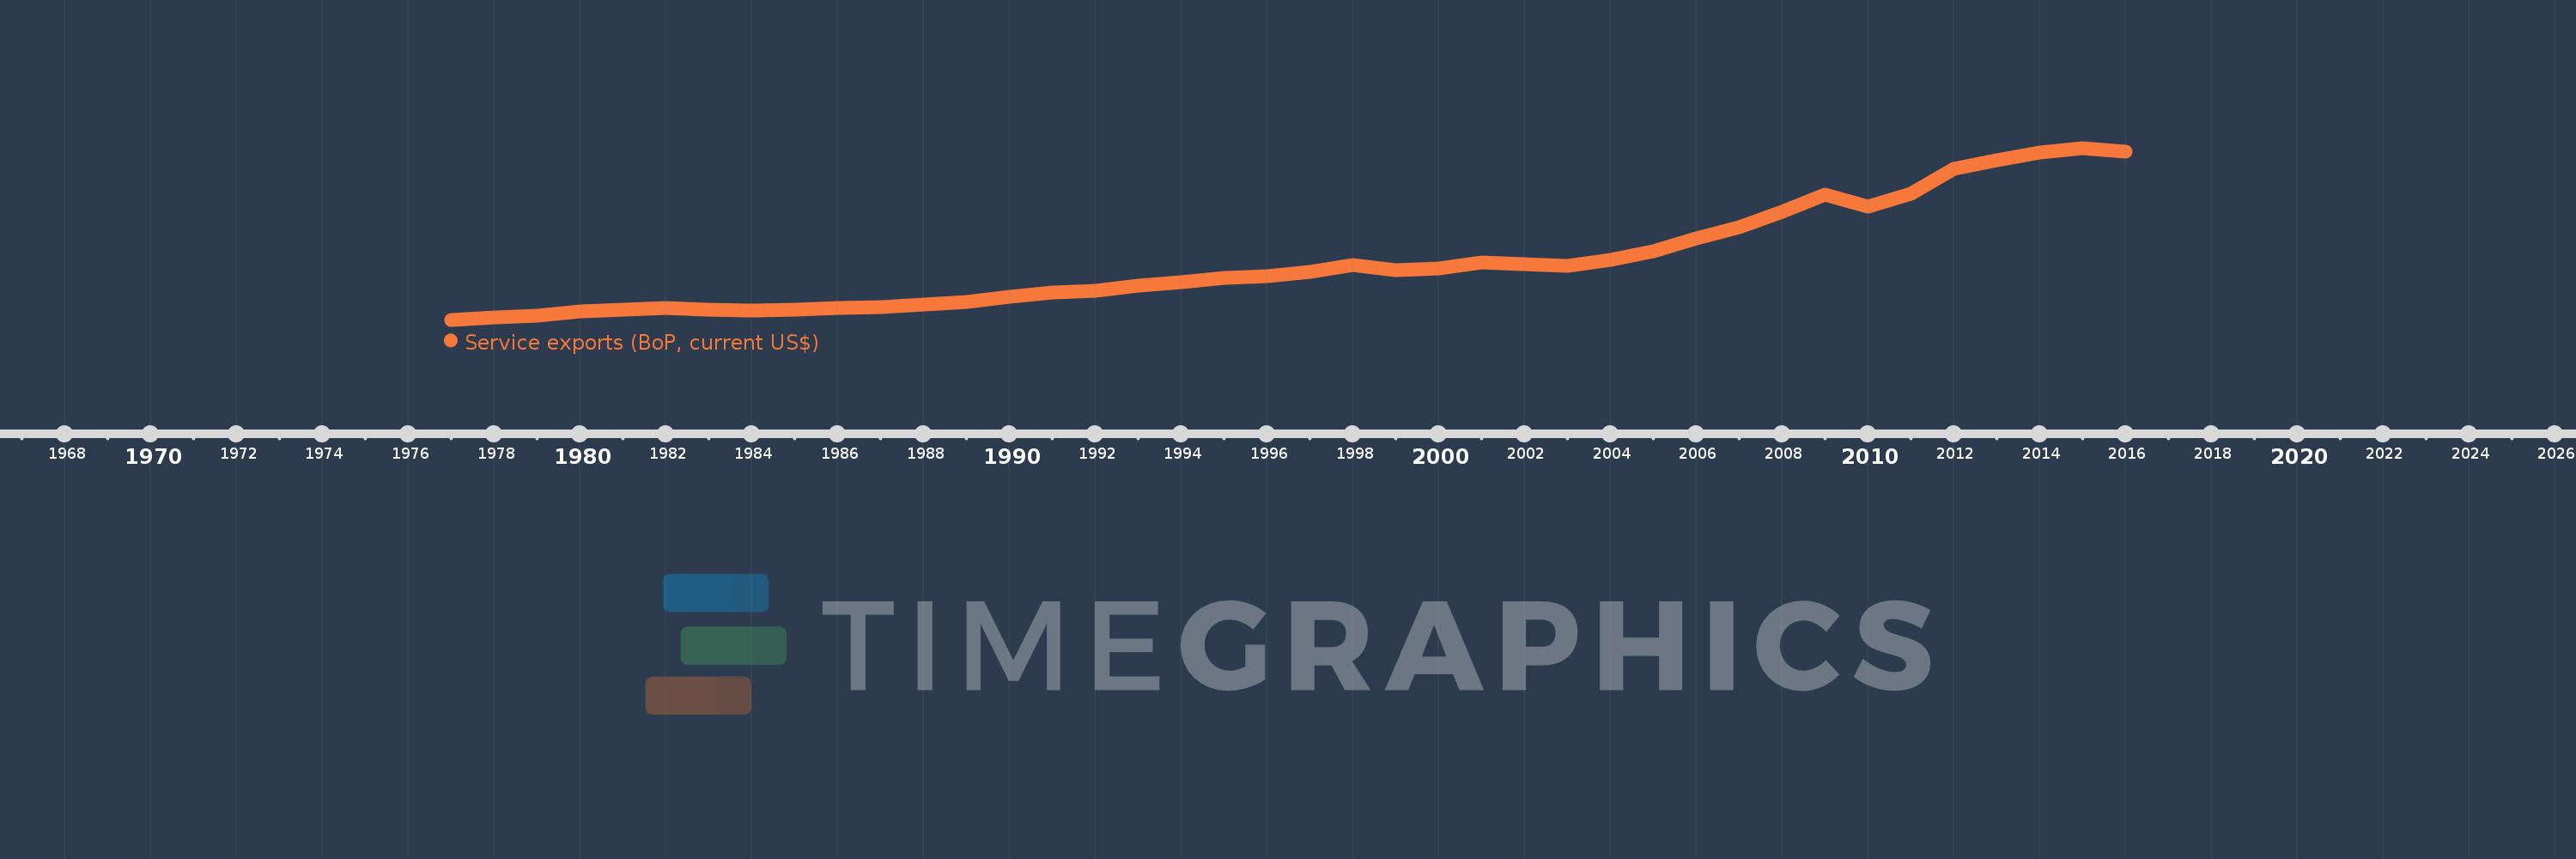
Service exports (BoP, current US$)
2016,2015,2014,2013,2012,2011,2010,2009,2008,2007,2006,2005,2004,2003,2002,2001,2000,1999,1998,1997,1996,1995,1994,1993,1992,1991,1990,1989,1988,1987,1986,1985,1984,1983,1982,1981,1980,1979,1978,1977
This statistics in other country:
AfghanistanAlbaniaAlgeriaAngolaAntigua and BarbudaArab WorldArgentinaArmeniaArubaAustraliaAustriaAzerbaijanBahamas, TheBahrainBangladeshBarbadosBelarusBelgiumBelizeBeninBermudaBhutanBoliviaBosnia and HerzegovinaBotswanaBrazilBrunei DarussalamBulgariaBurkina FasoBurundiCabo VerdeCambodiaCameroonCanadaCaribbean small statesCentral African RepublicCentral Europe and the BalticsChadChileChinaColombiaComorosCongo, Dem. Rep.Congo, Rep.Costa RicaCote d'IvoireCroatiaCuracaoCyprusCzech RepublicDenmarkDjiboutiDominicaDominican RepublicEarly-demographic dividendEast Asia & PacificEast Asia & Pacific (excluding high income)East Asia & Pacific (IDA & IBRD countries)EcuadorEgypt, Arab Rep.El SalvadorEquatorial GuineaEritreaEstoniaEthiopiaEuro areaEurope & Central AsiaEurope & Central Asia (excluding high income)Europe & Central Asia (IDA & IBRD countries)European UnionFaroe IslandsFijiFinlandFragile and conflict affected situationsFranceFrench PolynesiaGabonGambia, TheGeorgiaGermanyGhanaGreeceGrenadaGuatemalaGuineaGuinea-BissauGuyanaHaitiHeavily indebted poor countries (HIPC)High incomeHondurasHong Kong SAR, ChinaHungaryIBRD onlyIcelandIDA & IBRD totalIDA blendIDA onlyIDA totalIndiaIndonesiaIran, Islamic Rep.IraqIrelandIsraelItalyJamaicaJapanJordanKazakhstanKenyaKiribatiKorea, Rep.KosovoKuwaitKyrgyz RepublicLao PDRLate-demographic dividendLatin America & Caribbean Latin America & Caribbean (excluding high income)Latin America & the Caribbean (IDA & IBRD countries)LatviaLeast developed countries: UN classificationLebanonLesothoLiberiaLibyaLithuaniaLow & middle incomeLow incomeLower middle incomeLuxembourgMacao SAR, ChinaMacedonia, FYRMadagascarMalawiMalaysiaMaldivesMaliMaltaMarshall IslandsMauritaniaMauritiusMexicoMicronesia, Fed. Sts.Middle East & North Africa (excluding high income)Middle East & North Africa (IDA & IBRD countries)Middle incomeMoldovaMongoliaMontenegroMoroccoMozambiqueMyanmarNamibiaNepalNetherlandsNew CaledoniaNew ZealandNicaraguaNigerNigeriaNorth AmericaNorwayOECD membersOmanPacific island small statesPakistanPalauPanamaPapua New GuineaParaguayPeruPhilippinesPolandPortugalPost-demographic dividendPre-demographic dividendQatarRomaniaRussian FederationRwandaSamoaSao Tome and PrincipeSaudi ArabiaSenegalSerbiaSeychellesSierra LeoneSingaporeSint Maarten (Dutch part)Slovak RepublicSloveniaSolomon IslandsSouth AfricaSouth AsiaSouth Asia (IDA & IBRD)South SudanSpainSri LankaSt. Kitts and NevisSt. LuciaSt. Vincent and the GrenadinesSub-Saharan Africa Sub-Saharan Africa (excluding high income)Sub-Saharan Africa (IDA & IBRD countries)SudanSurinameSwazilandSwedenSwitzerlandSyrian Arab RepublicTajikistanTanzaniaThailandTimor-LesteTogoTongaTrinidad and TobagoTunisiaTurkeyTuvaluUgandaUkraineUnited KingdomUnited StatesUpper middle incomeUruguayVanuatuVenezuela, RBVietnamWest Bank and GazaWorldYemen, Rep.ZambiaZimbabwe Timeline:
This timeline shows a graph from 1977 to 2016 of Latin America & Caribbean . No data until 1976. Number of actual observations by date: 40.
Source name:
World Development Indicators
Source organization:
International Monetary Fund, Balance of Payments Statistics Yearbook and data files.
Categories, topics:
Economy & Growth, Trade
Last updated:
apr 23, 2017
Indicators value changes by year
Minimum:
9.98 bln
jan 1, 1977
Maximum:
179.408 bln
jan 1, 2015
At the date of observation
Value
Absolute change
Change from previous value
jan 1, 1977
9.98 bln
+9.98 bln
0.0%
jan 1, 1978
12.528 bln
+2.548 bln
25.53%
jan 1, 1979
14.127 bln
+1.599 bln
12.76%
jan 1, 1980
17.829 bln
+3.702 bln
26.21%
jan 1, 1981
20.206 bln
+2.377 bln
13.33%
jan 1, 1982
21.199 bln
+992.775 mln
4.91%
jan 1, 1983
19.73 bln
-1.469 bln
-6.93%
jan 1, 1984
18.876 bln
-854.236 mln
-4.33%
jan 1, 1985
20.293 bln
+1.417 bln
7.51%
jan 1, 1986
21.548 bln
+1.256 bln
6.19%
jan 1, 1987
22.359 bln
+810.325 mln
3.76%
jan 1, 1988
24.79 bln
+2.431 bln
10.87%
jan 1, 1989
27.871 bln
+3.082 bln
12.43%
jan 1, 1990
32.451 bln
+4.579 bln
16.43%
jan 1, 1991
36.73 bln
+4.279 bln
13.19%
jan 1, 1992
38.649 bln
+1.919 bln
5.23%
jan 1, 1993
43.369 bln
+4.719 bln
12.21%
jan 1, 1994
47.282 bln
+3.913 bln
9.02%
jan 1, 1995
51.456 bln
+4.175 bln
8.83%
jan 1, 1996
53.293 bln
+1.836 bln
3.57%
jan 1, 1997
56.818 bln
+3.525 bln
6.61%
jan 1, 1998
63.774 bln
+6.956 bln
12.24%
jan 1, 1999
58.979 bln
-4.795 bln
-7.52%
jan 1, 2000
60.236 bln
+1.257 bln
2.13%
jan 1, 2001
66.076 bln
+5.84 bln
9.7%
jan 1, 2002
64.702 bln
-1.375 bln
-2.08%
jan 1, 2003
63.329 bln
-1.373 bln
-2.12%
jan 1, 2004
68.793 bln
+5.464 bln
8.63%
jan 1, 2005
77.499 bln
+8.707 bln
12.66%
jan 1, 2006
90.43 bln
+12.931 bln
16.69%
jan 1, 2007
100.969 bln
+10.539 bln
11.65%
jan 1, 2008
116.807 bln
+15.838 bln
15.69%
jan 1, 2009
133.527 bln
+16.72 bln
14.31%
jan 1, 2010
121.385 bln
-12.143 bln
-9.09%
jan 1, 2011
134.131 bln
+12.747 bln
10.5%
jan 1, 2012
159.057 bln
+24.926 bln
18.58%
jan 1, 2013
166.895 bln
+7.837 bln
4.93%
jan 1, 2014
175.099 bln
+8.204 bln
4.92%
jan 1, 2015
179.408 bln
+4.309 bln
2.46%
jan 1, 2016
175.62 bln
-3.788 bln
-2.11%
Ranking of countries by current statistics by years


Comments: