29
/
en
AIzaSyAYiBZKx7MnpbEhh9jyipgxe19OcubqV5w
April 1, 2024
91860
Brazil
BRA
true
2
1
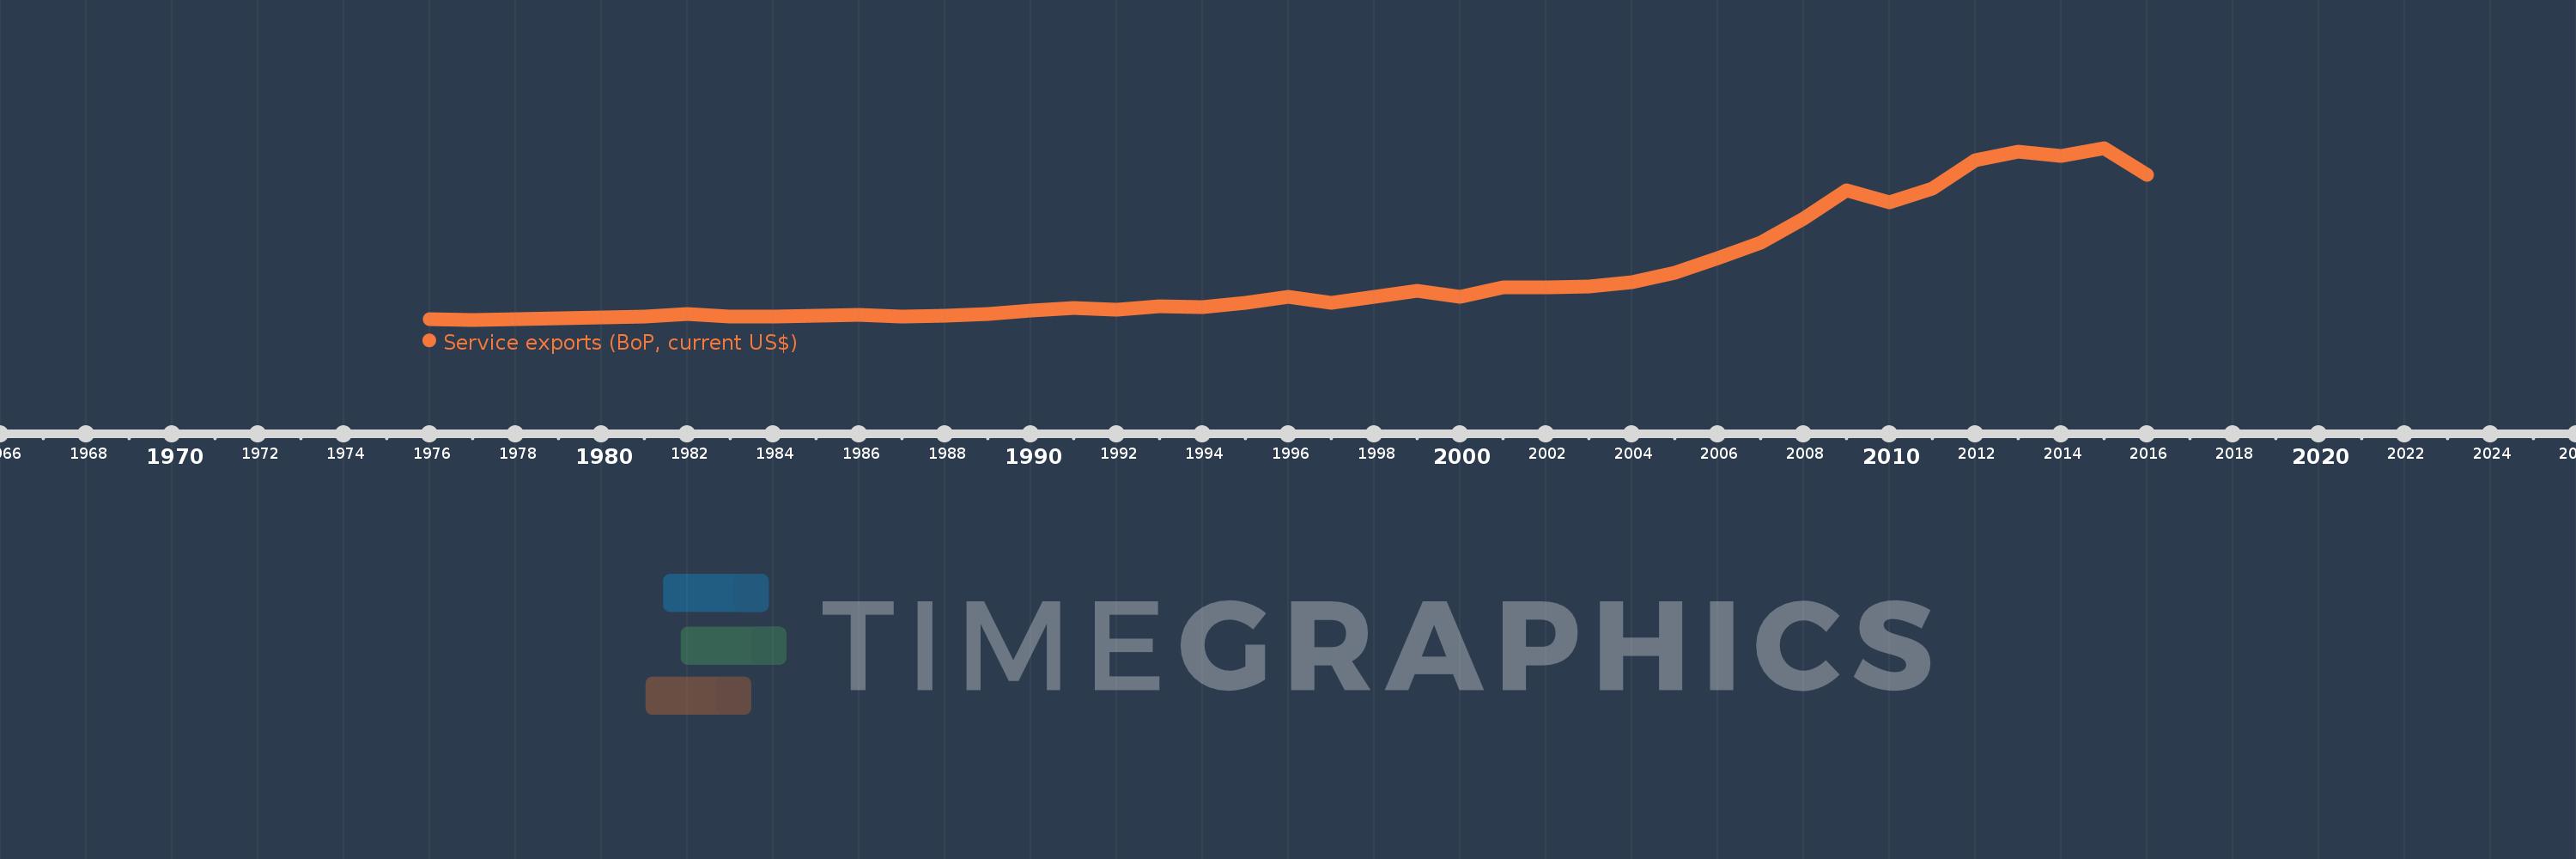
Service exports (BoP, current US$)
2016,2015,2014,2013,2012,2011,2010,2009,2008,2007,2006,2005,2004,2003,2002,2001,2000,1999,1998,1997,1996,1995,1994,1993,1992,1991,1990,1989,1988,1987,1986,1985,1984,1983,1982,1981,1980,1979,1978,1977,1976
This statistics in other country:
AfghanistanAlbaniaAlgeriaAngolaAntigua and BarbudaArab WorldArgentinaArmeniaArubaAustraliaAustriaAzerbaijanBahamas, TheBahrainBangladeshBarbadosBelarusBelgiumBelizeBeninBermudaBhutanBoliviaBosnia and HerzegovinaBotswanaBrazilBrunei DarussalamBulgariaBurkina FasoBurundiCabo VerdeCambodiaCameroonCanadaCaribbean small statesCentral African RepublicCentral Europe and the BalticsChadChileChinaColombiaComorosCongo, Dem. Rep.Congo, Rep.Costa RicaCote d'IvoireCroatiaCuracaoCyprusCzech RepublicDenmarkDjiboutiDominicaDominican RepublicEarly-demographic dividendEast Asia & PacificEast Asia & Pacific (excluding high income)East Asia & Pacific (IDA & IBRD countries)EcuadorEgypt, Arab Rep.El SalvadorEquatorial GuineaEritreaEstoniaEthiopiaEuro areaEurope & Central AsiaEurope & Central Asia (excluding high income)Europe & Central Asia (IDA & IBRD countries)European UnionFaroe IslandsFijiFinlandFragile and conflict affected situationsFranceFrench PolynesiaGabonGambia, TheGeorgiaGermanyGhanaGreeceGrenadaGuatemalaGuineaGuinea-BissauGuyanaHaitiHeavily indebted poor countries (HIPC)High incomeHondurasHong Kong SAR, ChinaHungaryIBRD onlyIcelandIDA & IBRD totalIDA blendIDA onlyIDA totalIndiaIndonesiaIran, Islamic Rep.IraqIrelandIsraelItalyJamaicaJapanJordanKazakhstanKenyaKiribatiKorea, Rep.KosovoKuwaitKyrgyz RepublicLao PDRLate-demographic dividendLatin America & Caribbean Latin America & Caribbean (excluding high income)Latin America & the Caribbean (IDA & IBRD countries)LatviaLeast developed countries: UN classificationLebanonLesothoLiberiaLibyaLithuaniaLow & middle incomeLow incomeLower middle incomeLuxembourgMacao SAR, ChinaMacedonia, FYRMadagascarMalawiMalaysiaMaldivesMaliMaltaMarshall IslandsMauritaniaMauritiusMexicoMicronesia, Fed. Sts.Middle East & North Africa (excluding high income)Middle East & North Africa (IDA & IBRD countries)Middle incomeMoldovaMongoliaMontenegroMoroccoMozambiqueMyanmarNamibiaNepalNetherlandsNew CaledoniaNew ZealandNicaraguaNigerNigeriaNorth AmericaNorwayOECD membersOmanPacific island small statesPakistanPalauPanamaPapua New GuineaParaguayPeruPhilippinesPolandPortugalPost-demographic dividendPre-demographic dividendQatarRomaniaRussian FederationRwandaSamoaSao Tome and PrincipeSaudi ArabiaSenegalSerbiaSeychellesSierra LeoneSingaporeSint Maarten (Dutch part)Slovak RepublicSloveniaSolomon IslandsSouth AfricaSouth AsiaSouth Asia (IDA & IBRD)South SudanSpainSri LankaSt. Kitts and NevisSt. LuciaSt. Vincent and the GrenadinesSub-Saharan Africa Sub-Saharan Africa (excluding high income)Sub-Saharan Africa (IDA & IBRD countries)SudanSurinameSwazilandSwedenSwitzerlandSyrian Arab RepublicTajikistanTanzaniaThailandTimor-LesteTogoTongaTrinidad and TobagoTunisiaTurkeyTuvaluUgandaUkraineUnited KingdomUnited StatesUpper middle incomeUruguayVanuatuVenezuela, RBVietnamWest Bank and GazaWorldYemen, Rep.ZambiaZimbabwe Timeline:
This timeline shows a graph from 1976 to 2016 of Brazil. No data until 1975. Number of actual observations by date: 41.
Source name:
World Development Indicators
Source organization:
International Monetary Fund, Balance of Payments Statistics Yearbook and data files.
Categories, topics:
Economy & Growth, Trade
Last updated:
apr 23, 2017
Indicators value changes by year
Minimum:
1.018 bln
jan 1, 1977
Maximum:
39.965 bln
jan 1, 2015
At the date of observation
Value
Absolute change
Change from previous value
jan 1, 1976
1.06 bln
+1.06 bln
0.0%
jan 1, 1977
1.018 bln
-42.0 mln
-3.96%
jan 1, 1978
1.207 bln
+189.0 mln
18.57%
jan 1, 1979
1.35 bln
+143.0 mln
11.85%
jan 1, 1980
1.475 bln
+125.0 mln
9.26%
jan 1, 1981
1.737 bln
+262.0 mln
17.76%
jan 1, 1982
2.265 bln
+528.0 mln
30.4%
jan 1, 1983
1.809 bln
-456.0 mln
-20.13%
jan 1, 1984
1.724 bln
-85.0 mln
-4.7%
jan 1, 1985
1.947 bln
+223.0 mln
12.94%
jan 1, 1986
2.086 bln
+139.0 mln
7.14%
jan 1, 1987
1.816 bln
-270.0 mln
-12.94%
jan 1, 1988
1.952 bln
+136.0 mln
7.49%
jan 1, 1989
2.279 bln
+327.0 mln
16.75%
jan 1, 1990
3.132 bln
+853.0 mln
37.43%
jan 1, 1991
3.762 bln
+630.0 mln
20.11%
jan 1, 1992
3.319 bln
-443.0 mln
-11.78%
jan 1, 1993
4.088 bln
+769.0 mln
23.17%
jan 1, 1994
3.971 bln
-117.0 mln
-2.86%
jan 1, 1995
4.908 bln
+937.0 mln
23.6%
jan 1, 1996
6.135 bln
+1.227 bln
25.0%
jan 1, 1997
4.76 bln
-1.375 bln
-22.41%
jan 1, 1998
6.187 bln
+1.427 bln
29.98%
jan 1, 1999
7.646 bln
+1.459 bln
23.58%
jan 1, 2000
6.3 bln
-1.346 bln
-17.6%
jan 1, 2001
8.437 bln
+2.137 bln
33.92%
jan 1, 2002
8.317 bln
-119.604 mln
-1.42%
jan 1, 2003
8.593 bln
+276.09 mln
3.32%
jan 1, 2004
9.577 bln
+984.248 mln
11.45%
jan 1, 2005
11.744 bln
+2.167 bln
22.62%
jan 1, 2006
14.976 bln
+3.232 bln
27.52%
jan 1, 2007
18.495 bln
+3.519 bln
23.5%
jan 1, 2008
23.954 bln
+5.459 bln
29.52%
jan 1, 2009
30.451 bln
+6.496 bln
27.12%
jan 1, 2010
27.728 bln
-2.722 bln
-8.94%
jan 1, 2011
30.8 bln
+3.072 bln
11.08%
jan 1, 2012
37.106 bln
+6.305 bln
20.47%
jan 1, 2013
39.136 bln
+2.03 bln
5.47%
jan 1, 2014
38.112 bln
-1.023 bln
-2.61%
jan 1, 2015
39.965 bln
+1.853 bln
4.86%
jan 1, 2016
33.778 bln
-6.188 bln
-15.48%
Ranking of countries by current statistics by years


Comments: