29
/
en
AIzaSyAYiBZKx7MnpbEhh9jyipgxe19OcubqV5w
April 1, 2024
126907
El Salvador
SLV
true
2
1
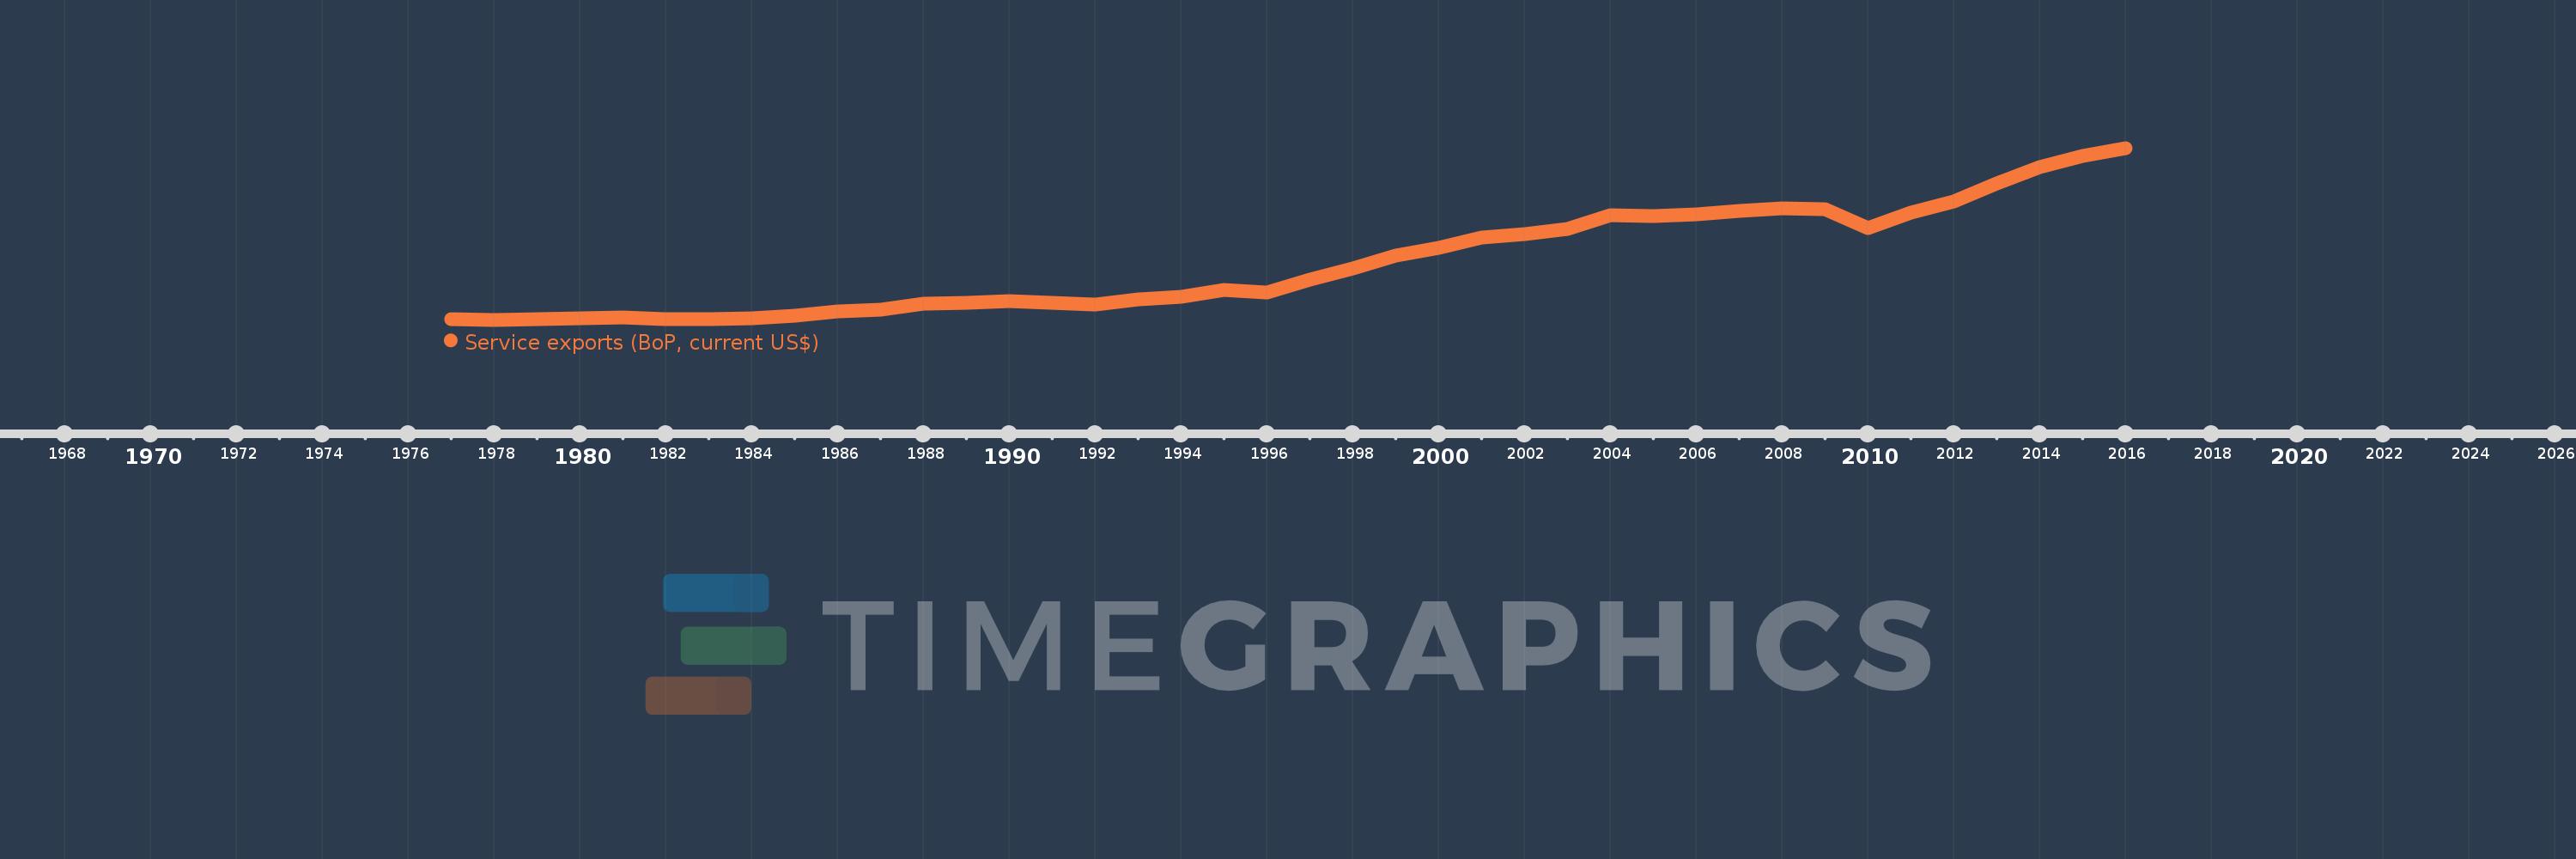
Service exports (BoP, current US$)
2016,2015,2014,2013,2012,2011,2010,2009,2008,2007,2006,2005,2004,2003,2002,2001,2000,1999,1998,1997,1996,1995,1994,1993,1992,1991,1990,1989,1988,1987,1986,1985,1984,1983,1982,1981,1980,1979,1978,1977
This statistics in other country:
AfghanistanAlbaniaAlgeriaAngolaAntigua and BarbudaArab WorldArgentinaArmeniaArubaAustraliaAustriaAzerbaijanBahamas, TheBahrainBangladeshBarbadosBelarusBelgiumBelizeBeninBermudaBhutanBoliviaBosnia and HerzegovinaBotswanaBrazilBrunei DarussalamBulgariaBurkina FasoBurundiCabo VerdeCambodiaCameroonCanadaCaribbean small statesCentral African RepublicCentral Europe and the BalticsChadChileChinaColombiaComorosCongo, Dem. Rep.Congo, Rep.Costa RicaCote d'IvoireCroatiaCuracaoCyprusCzech RepublicDenmarkDjiboutiDominicaDominican RepublicEarly-demographic dividendEast Asia & PacificEast Asia & Pacific (excluding high income)East Asia & Pacific (IDA & IBRD countries)EcuadorEgypt, Arab Rep.El SalvadorEquatorial GuineaEritreaEstoniaEthiopiaEuro areaEurope & Central AsiaEurope & Central Asia (excluding high income)Europe & Central Asia (IDA & IBRD countries)European UnionFaroe IslandsFijiFinlandFragile and conflict affected situationsFranceFrench PolynesiaGabonGambia, TheGeorgiaGermanyGhanaGreeceGrenadaGuatemalaGuineaGuinea-BissauGuyanaHaitiHeavily indebted poor countries (HIPC)High incomeHondurasHong Kong SAR, ChinaHungaryIBRD onlyIcelandIDA & IBRD totalIDA blendIDA onlyIDA totalIndiaIndonesiaIran, Islamic Rep.IraqIrelandIsraelItalyJamaicaJapanJordanKazakhstanKenyaKiribatiKorea, Rep.KosovoKuwaitKyrgyz RepublicLao PDRLate-demographic dividendLatin America & Caribbean Latin America & Caribbean (excluding high income)Latin America & the Caribbean (IDA & IBRD countries)LatviaLeast developed countries: UN classificationLebanonLesothoLiberiaLibyaLithuaniaLow & middle incomeLow incomeLower middle incomeLuxembourgMacao SAR, ChinaMacedonia, FYRMadagascarMalawiMalaysiaMaldivesMaliMaltaMarshall IslandsMauritaniaMauritiusMexicoMicronesia, Fed. Sts.Middle East & North Africa (excluding high income)Middle East & North Africa (IDA & IBRD countries)Middle incomeMoldovaMongoliaMontenegroMoroccoMozambiqueMyanmarNamibiaNepalNetherlandsNew CaledoniaNew ZealandNicaraguaNigerNigeriaNorth AmericaNorwayOECD membersOmanPacific island small statesPakistanPalauPanamaPapua New GuineaParaguayPeruPhilippinesPolandPortugalPost-demographic dividendPre-demographic dividendQatarRomaniaRussian FederationRwandaSamoaSao Tome and PrincipeSaudi ArabiaSenegalSerbiaSeychellesSierra LeoneSingaporeSint Maarten (Dutch part)Slovak RepublicSloveniaSolomon IslandsSouth AfricaSouth AsiaSouth Asia (IDA & IBRD)South SudanSpainSri LankaSt. Kitts and NevisSt. LuciaSt. Vincent and the GrenadinesSub-Saharan Africa Sub-Saharan Africa (excluding high income)Sub-Saharan Africa (IDA & IBRD countries)SudanSurinameSwazilandSwedenSwitzerlandSyrian Arab RepublicTajikistanTanzaniaThailandTimor-LesteTogoTongaTrinidad and TobagoTunisiaTurkeyTuvaluUgandaUkraineUnited KingdomUnited StatesUpper middle incomeUruguayVanuatuVenezuela, RBVietnamWest Bank and GazaWorldYemen, Rep.ZambiaZimbabwe Timeline:
This timeline shows a graph from 1977 to 2016 of El Salvador. No data until 1976. Number of actual observations by date: 40.
Source name:
World Development Indicators
Source organization:
International Monetary Fund, Balance of Payments Statistics Yearbook and data files.
Categories, topics:
Economy & Growth, Trade
Last updated:
apr 23, 2017
Indicators value changes by year
Minimum:
112.96 mln
jan 1, 1978
Maximum:
2.33 bln
jan 1, 2016
At the date of observation
Value
Absolute change
Change from previous value
jan 1, 1977
116.12 mln
+116.12 mln
0.0%
jan 1, 1978
112.96 mln
-3.16 mln
-2.72%
jan 1, 1979
120.96 mln
+8.0 mln
7.08%
jan 1, 1980
133.0 mln
+12.04 mln
9.95%
jan 1, 1981
138.84 mln
+5.84 mln
4.39%
jan 1, 1982
124.68 mln
-14.16 mln
-10.2%
jan 1, 1983
117.4 mln
-7.28 mln
-5.84%
jan 1, 1984
135.84 mln
+18.44 mln
15.71%
jan 1, 1985
165.4 mln
+29.56 mln
21.76%
jan 1, 1986
223.92 mln
+58.52 mln
35.38%
jan 1, 1987
241.068 mln
+17.148 mln
7.66%
jan 1, 1988
318.14 mln
+77.072 mln
31.97%
jan 1, 1989
328.0 mln
+9.86 mln
3.1%
jan 1, 1990
351.02 mln
+23.02 mln
7.02%
jan 1, 1991
329.233 mln
-21.787 mln
-6.21%
jan 1, 1992
310.915 mln
-18.319 mln
-5.56%
jan 1, 1993
377.116 mln
+66.201 mln
21.29%
jan 1, 1994
405.63 mln
+28.515 mln
7.56%
jan 1, 1995
495.833 mln
+90.203 mln
22.24%
jan 1, 1996
462.158 mln
-33.675 mln
-6.79%
jan 1, 1997
627.87 mln
+165.712 mln
35.86%
jan 1, 1998
776.017 mln
+148.147 mln
23.6%
jan 1, 1999
941.862 mln
+165.845 mln
21.37%
jan 1, 2000
1.041 bln
+99.138 mln
10.53%
jan 1, 2001
1.174 bln
+133.0 mln
12.78%
jan 1, 2002
1.218 bln
+43.8 mln
3.73%
jan 1, 2003
1.28 bln
+62.1 mln
5.1%
jan 1, 2004
1.464 bln
+183.892 mln
14.37%
jan 1, 2005
1.448 bln
-15.923 mln
-1.09%
jan 1, 2006
1.478 bln
+30.161 mln
2.08%
jan 1, 2007
1.516 bln
+37.94 mln
2.57%
jan 1, 2008
1.556 bln
+39.69 mln
2.62%
jan 1, 2009
1.534 bln
-21.41 mln
-1.38%
jan 1, 2010
1.292 bln
-242.034 mln
-15.78%
jan 1, 2011
1.498 bln
+205.746 mln
15.92%
jan 1, 2012
1.636 bln
+138.001 mln
9.21%
jan 1, 2013
1.867 bln
+230.793 mln
14.11%
jan 1, 2014
2.087 bln
+220.723 mln
11.82%
jan 1, 2015
2.226 bln
+138.805 mln
6.65%
jan 1, 2016
2.33 bln
+103.441 mln
4.65%
Ranking of countries by current statistics by years


Comments: