29
/
en
AIzaSyAYiBZKx7MnpbEhh9jyipgxe19OcubqV5w
April 1, 2024
202291
Morocco
MAR
true
2
1
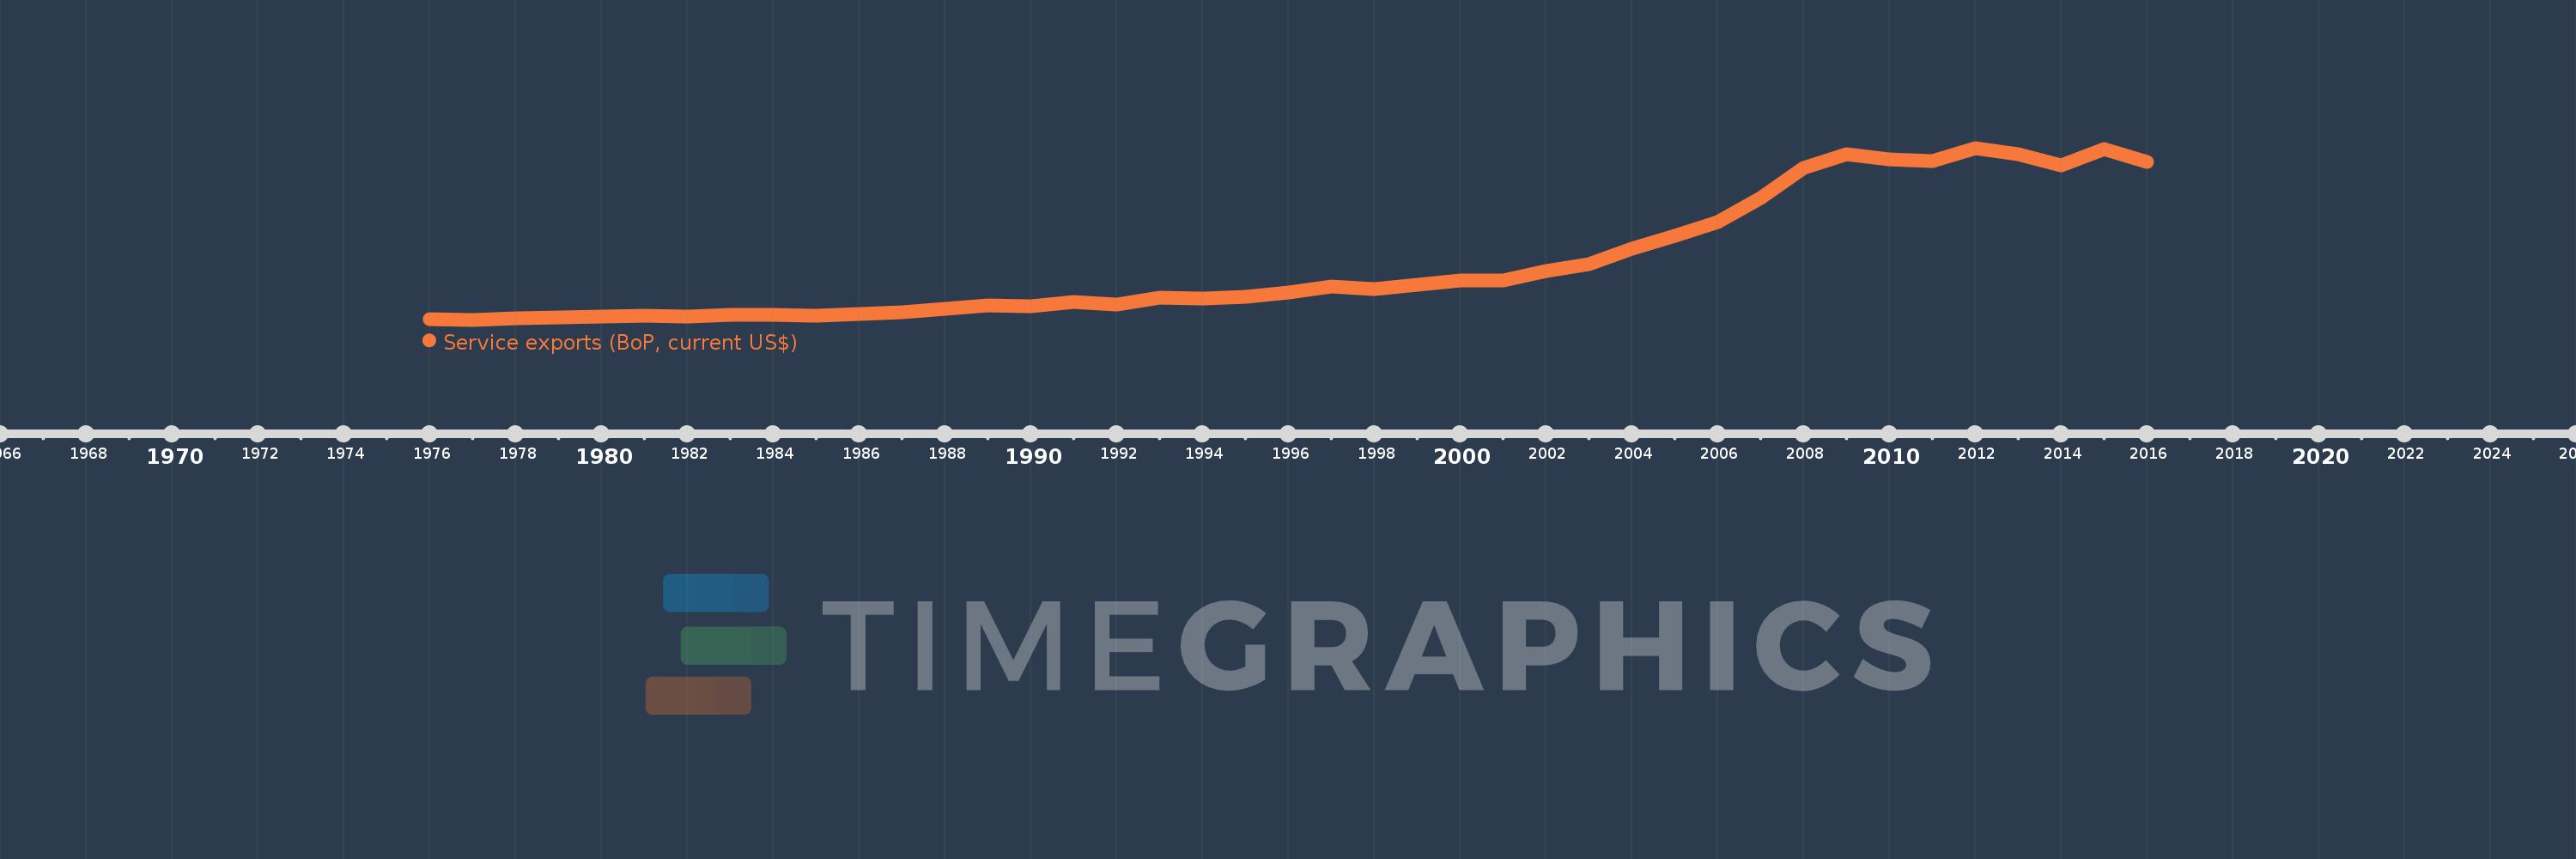
Service exports (BoP, current US$)
2016,2015,2014,2013,2012,2011,2010,2009,2008,2007,2006,2005,2004,2003,2002,2001,2000,1999,1998,1997,1996,1995,1994,1993,1992,1991,1990,1989,1988,1987,1986,1985,1984,1983,1982,1981,1980,1979,1978,1977,1976
This statistics in other country:
AfghanistanAlbaniaAlgeriaAngolaAntigua and BarbudaArab WorldArgentinaArmeniaArubaAustraliaAustriaAzerbaijanBahamas, TheBahrainBangladeshBarbadosBelarusBelgiumBelizeBeninBermudaBhutanBoliviaBosnia and HerzegovinaBotswanaBrazilBrunei DarussalamBulgariaBurkina FasoBurundiCabo VerdeCambodiaCameroonCanadaCaribbean small statesCentral African RepublicCentral Europe and the BalticsChadChileChinaColombiaComorosCongo, Dem. Rep.Congo, Rep.Costa RicaCote d'IvoireCroatiaCuracaoCyprusCzech RepublicDenmarkDjiboutiDominicaDominican RepublicEarly-demographic dividendEast Asia & PacificEast Asia & Pacific (excluding high income)East Asia & Pacific (IDA & IBRD countries)EcuadorEgypt, Arab Rep.El SalvadorEquatorial GuineaEritreaEstoniaEthiopiaEuro areaEurope & Central AsiaEurope & Central Asia (excluding high income)Europe & Central Asia (IDA & IBRD countries)European UnionFaroe IslandsFijiFinlandFragile and conflict affected situationsFranceFrench PolynesiaGabonGambia, TheGeorgiaGermanyGhanaGreeceGrenadaGuatemalaGuineaGuinea-BissauGuyanaHaitiHeavily indebted poor countries (HIPC)High incomeHondurasHong Kong SAR, ChinaHungaryIBRD onlyIcelandIDA & IBRD totalIDA blendIDA onlyIDA totalIndiaIndonesiaIran, Islamic Rep.IraqIrelandIsraelItalyJamaicaJapanJordanKazakhstanKenyaKiribatiKorea, Rep.KosovoKuwaitKyrgyz RepublicLao PDRLate-demographic dividendLatin America & Caribbean Latin America & Caribbean (excluding high income)Latin America & the Caribbean (IDA & IBRD countries)LatviaLeast developed countries: UN classificationLebanonLesothoLiberiaLibyaLithuaniaLow & middle incomeLow incomeLower middle incomeLuxembourgMacao SAR, ChinaMacedonia, FYRMadagascarMalawiMalaysiaMaldivesMaliMaltaMarshall IslandsMauritaniaMauritiusMexicoMicronesia, Fed. Sts.Middle East & North Africa (excluding high income)Middle East & North Africa (IDA & IBRD countries)Middle incomeMoldovaMongoliaMontenegroMoroccoMozambiqueMyanmarNamibiaNepalNetherlandsNew CaledoniaNew ZealandNicaraguaNigerNigeriaNorth AmericaNorwayOECD membersOmanPacific island small statesPakistanPalauPanamaPapua New GuineaParaguayPeruPhilippinesPolandPortugalPost-demographic dividendPre-demographic dividendQatarRomaniaRussian FederationRwandaSamoaSao Tome and PrincipeSaudi ArabiaSenegalSerbiaSeychellesSierra LeoneSingaporeSint Maarten (Dutch part)Slovak RepublicSloveniaSolomon IslandsSouth AfricaSouth AsiaSouth Asia (IDA & IBRD)South SudanSpainSri LankaSt. Kitts and NevisSt. LuciaSt. Vincent and the GrenadinesSub-Saharan Africa Sub-Saharan Africa (excluding high income)Sub-Saharan Africa (IDA & IBRD countries)SudanSurinameSwazilandSwedenSwitzerlandSyrian Arab RepublicTajikistanTanzaniaThailandTimor-LesteTogoTongaTrinidad and TobagoTunisiaTurkeyTuvaluUgandaUkraineUnited KingdomUnited StatesUpper middle incomeUruguayVanuatuVenezuela, RBVietnamWest Bank and GazaWorldYemen, Rep.ZambiaZimbabwe Timeline:
This timeline shows a graph from 1976 to 2016 of Morocco. No data until 1975. Number of actual observations by date: 41.
Source name:
World Development Indicators
Source organization:
International Monetary Fund, Balance of Payments Statistics Yearbook and data files.
Categories, topics:
Economy & Growth, Trade
Last updated:
apr 23, 2017
Indicators value changes by year
Minimum:
434.004 mln
jan 1, 1977
Maximum:
15.899 bln
jan 1, 2012
At the date of observation
Value
Absolute change
Change from previous value
jan 1, 1976
459.142 mln
+459.142 mln
0.0%
jan 1, 1977
434.004 mln
-25.138 mln
-5.47%
jan 1, 1978
538.785 mln
+104.78 mln
24.14%
jan 1, 1979
635.599 mln
+96.815 mln
17.97%
jan 1, 1980
717.253 mln
+81.654 mln
12.85%
jan 1, 1981
782.731 mln
+65.477 mln
9.13%
jan 1, 1982
726.95 mln
-55.781 mln
-7.13%
jan 1, 1983
848.909 mln
+121.959 mln
16.78%
jan 1, 1984
845.272 mln
-3.638 mln
-0.43%
jan 1, 1985
829.726 mln
-15.545 mln
-1.84%
jan 1, 1986
983.222 mln
+153.496 mln
18.5%
jan 1, 1987
1.133 bln
+149.668 mln
15.22%
jan 1, 1988
1.379 bln
+246.185 mln
21.73%
jan 1, 1989
1.764 bln
+384.445 mln
27.88%
jan 1, 1990
1.65 bln
-113.616 mln
-6.44%
jan 1, 1991
2.009 bln
+359.517 mln
21.79%
jan 1, 1992
1.835 bln
-174.825 mln
-8.7%
jan 1, 1993
2.4 bln
+564.947 mln
30.79%
jan 1, 1994
2.372 bln
-28.031 mln
-1.17%
jan 1, 1995
2.484 bln
+112.646 mln
4.75%
jan 1, 1996
2.853 bln
+369.276 mln
14.87%
jan 1, 1997
3.432 bln
+578.808 mln
20.28%
jan 1, 1998
3.186 bln
-246.281 mln
-7.18%
jan 1, 1999
3.613 bln
+427.064 mln
13.4%
jan 1, 2000
3.952 bln
+339.274 mln
9.39%
jan 1, 2001
3.991 bln
+38.257 mln
0.97%
jan 1, 2002
4.844 bln
+853.018 mln
21.38%
jan 1, 2003
5.424 bln
+580.821 mln
11.99%
jan 1, 2004
6.804 bln
+1.38 bln
25.43%
jan 1, 2005
8.015 bln
+1.211 bln
17.8%
jan 1, 2006
9.264 bln
+1.249 bln
15.59%
jan 1, 2007
11.377 bln
+2.113 bln
22.8%
jan 1, 2008
14.065 bln
+2.688 bln
23.63%
jan 1, 2009
15.302 bln
+1.237 bln
8.79%
jan 1, 2010
14.833 bln
-468.973 mln
-3.06%
jan 1, 2011
14.736 bln
-96.647 mln
-0.65%
jan 1, 2012
15.899 bln
+1.163 bln
7.89%
jan 1, 2013
15.347 bln
-552.438 mln
-3.47%
jan 1, 2014
14.353 bln
-993.976 mln
-6.48%
jan 1, 2015
15.831 bln
+1.479 bln
10.3%
jan 1, 2016
14.673 bln
-1.158 bln
-7.31%
Ranking of countries by current statistics by years


Comments: