29
/
en
AIzaSyAYiBZKx7MnpbEhh9jyipgxe19OcubqV5w
April 1, 2024
117410
Cyprus
CYP
true
2
1
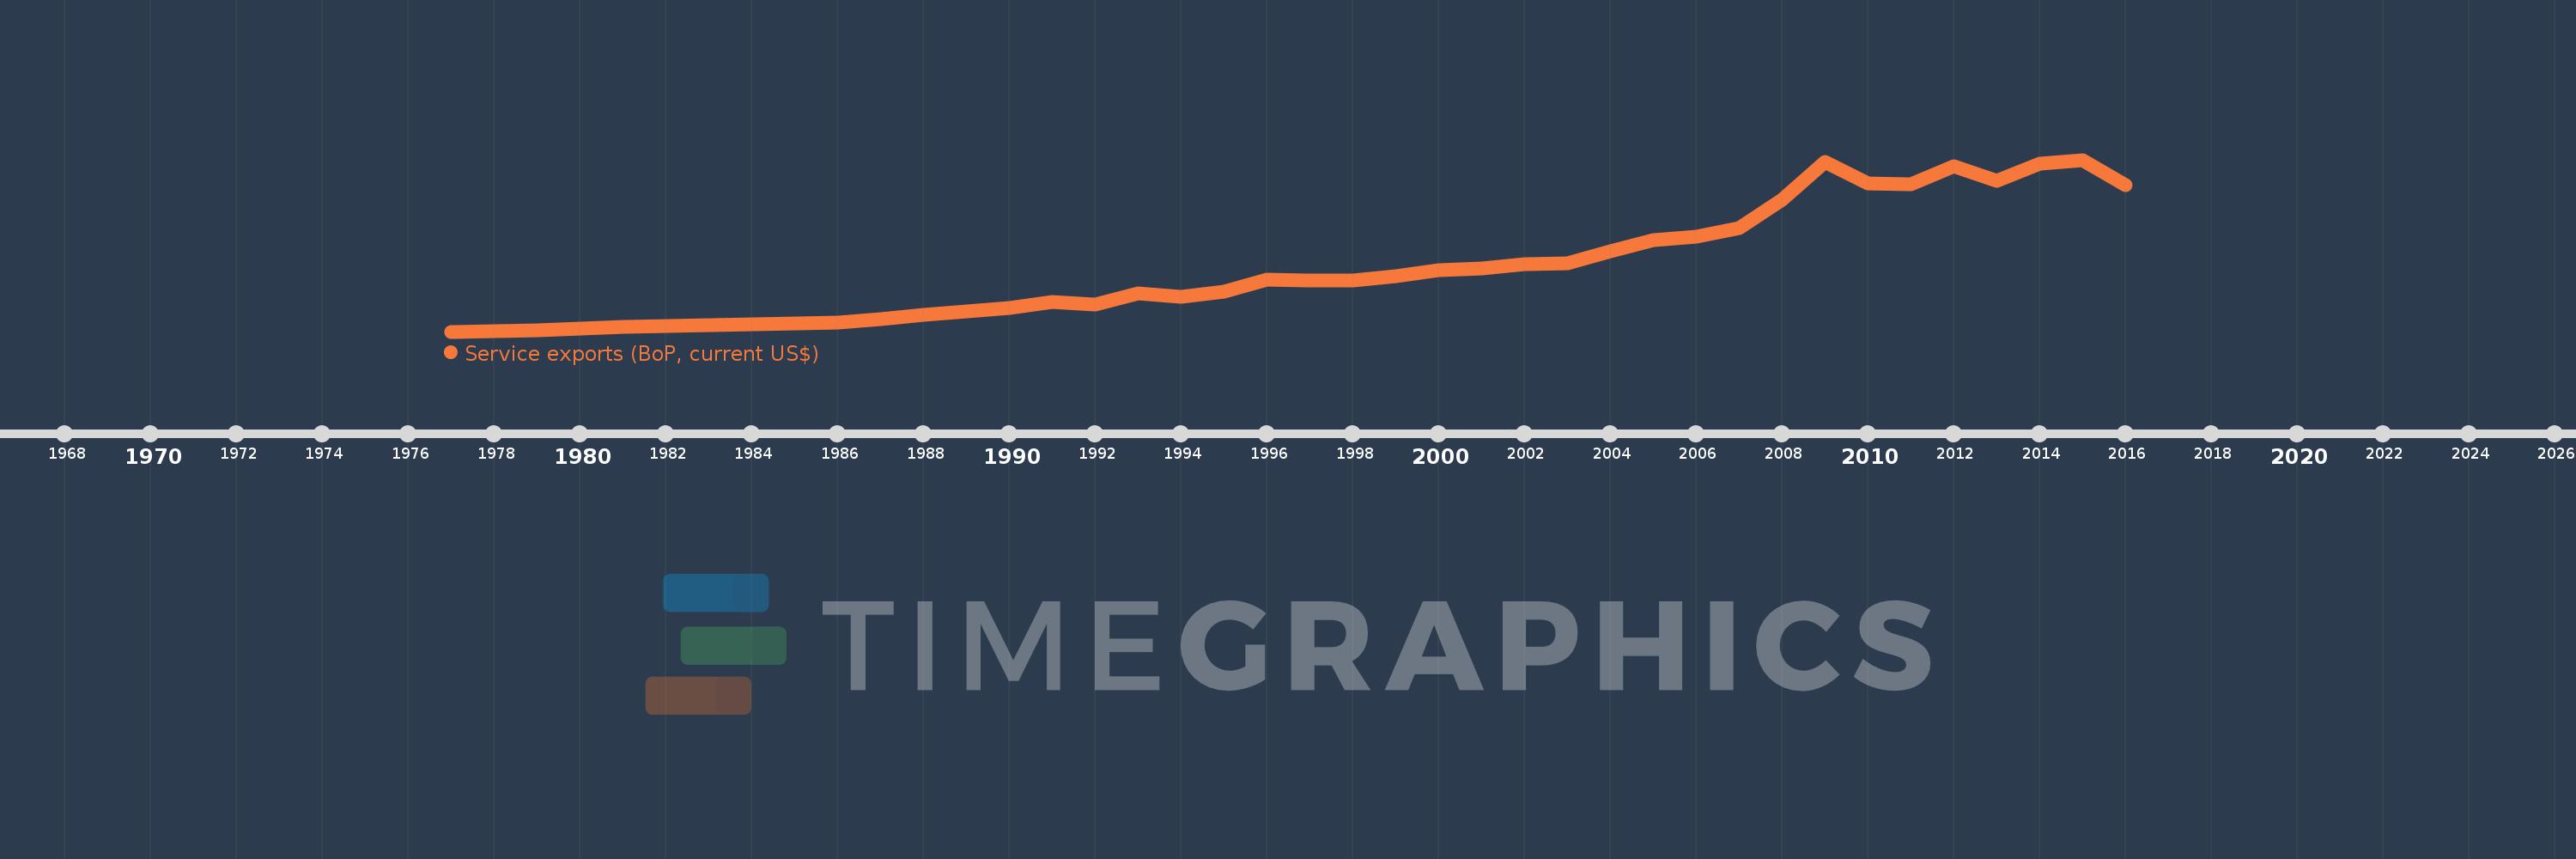
Service exports (BoP, current US$)
2016,2015,2014,2013,2012,2011,2010,2009,2008,2007,2006,2005,2004,2003,2002,2001,2000,1999,1998,1997,1996,1995,1994,1993,1992,1991,1990,1989,1988,1987,1986,1985,1984,1983,1982,1981,1980,1979,1978,1977
This statistics in other country:
AfghanistanAlbaniaAlgeriaAngolaAntigua and BarbudaArab WorldArgentinaArmeniaArubaAustraliaAustriaAzerbaijanBahamas, TheBahrainBangladeshBarbadosBelarusBelgiumBelizeBeninBermudaBhutanBoliviaBosnia and HerzegovinaBotswanaBrazilBrunei DarussalamBulgariaBurkina FasoBurundiCabo VerdeCambodiaCameroonCanadaCaribbean small statesCentral African RepublicCentral Europe and the BalticsChadChileChinaColombiaComorosCongo, Dem. Rep.Congo, Rep.Costa RicaCote d'IvoireCroatiaCuracaoCyprusCzech RepublicDenmarkDjiboutiDominicaDominican RepublicEarly-demographic dividendEast Asia & PacificEast Asia & Pacific (excluding high income)East Asia & Pacific (IDA & IBRD countries)EcuadorEgypt, Arab Rep.El SalvadorEquatorial GuineaEritreaEstoniaEthiopiaEuro areaEurope & Central AsiaEurope & Central Asia (excluding high income)Europe & Central Asia (IDA & IBRD countries)European UnionFaroe IslandsFijiFinlandFragile and conflict affected situationsFranceFrench PolynesiaGabonGambia, TheGeorgiaGermanyGhanaGreeceGrenadaGuatemalaGuineaGuinea-BissauGuyanaHaitiHeavily indebted poor countries (HIPC)High incomeHondurasHong Kong SAR, ChinaHungaryIBRD onlyIcelandIDA & IBRD totalIDA blendIDA onlyIDA totalIndiaIndonesiaIran, Islamic Rep.IraqIrelandIsraelItalyJamaicaJapanJordanKazakhstanKenyaKiribatiKorea, Rep.KosovoKuwaitKyrgyz RepublicLao PDRLate-demographic dividendLatin America & Caribbean Latin America & Caribbean (excluding high income)Latin America & the Caribbean (IDA & IBRD countries)LatviaLeast developed countries: UN classificationLebanonLesothoLiberiaLibyaLithuaniaLow & middle incomeLow incomeLower middle incomeLuxembourgMacao SAR, ChinaMacedonia, FYRMadagascarMalawiMalaysiaMaldivesMaliMaltaMarshall IslandsMauritaniaMauritiusMexicoMicronesia, Fed. Sts.Middle East & North Africa (excluding high income)Middle East & North Africa (IDA & IBRD countries)Middle incomeMoldovaMongoliaMontenegroMoroccoMozambiqueMyanmarNamibiaNepalNetherlandsNew CaledoniaNew ZealandNicaraguaNigerNigeriaNorth AmericaNorwayOECD membersOmanPacific island small statesPakistanPalauPanamaPapua New GuineaParaguayPeruPhilippinesPolandPortugalPost-demographic dividendPre-demographic dividendQatarRomaniaRussian FederationRwandaSamoaSao Tome and PrincipeSaudi ArabiaSenegalSerbiaSeychellesSierra LeoneSingaporeSint Maarten (Dutch part)Slovak RepublicSloveniaSolomon IslandsSouth AfricaSouth AsiaSouth Asia (IDA & IBRD)South SudanSpainSri LankaSt. Kitts and NevisSt. LuciaSt. Vincent and the GrenadinesSub-Saharan Africa Sub-Saharan Africa (excluding high income)Sub-Saharan Africa (IDA & IBRD countries)SudanSurinameSwazilandSwedenSwitzerlandSyrian Arab RepublicTajikistanTanzaniaThailandTimor-LesteTogoTongaTrinidad and TobagoTunisiaTurkeyTuvaluUgandaUkraineUnited KingdomUnited StatesUpper middle incomeUruguayVanuatuVenezuela, RBVietnamWest Bank and GazaWorldYemen, Rep.ZambiaZimbabwe Timeline:
This timeline shows a graph from 1977 to 2016 of Cyprus. No data until 1976. Number of actual observations by date: 40.
Source name:
World Development Indicators
Source organization:
International Monetary Fund, Balance of Payments Statistics Yearbook and data files.
Categories, topics:
Economy & Growth, Trade
Last updated:
apr 23, 2017
Indicators value changes by year
Minimum:
175.885 mln
jan 1, 1977
Maximum:
10.758 bln
jan 1, 2015
At the date of observation
Value
Absolute change
Change from previous value
jan 1, 1977
175.885 mln
+175.885 mln
0.0%
jan 1, 1978
206.556 mln
+30.671 mln
17.44%
jan 1, 1979
258.626 mln
+52.07 mln
25.21%
jan 1, 1980
371.286 mln
+112.66 mln
43.56%
jan 1, 1981
481.799 mln
+110.513 mln
29.77%
jan 1, 1982
526.54 mln
+44.74 mln
9.29%
jan 1, 1983
577.215 mln
+50.676 mln
9.62%
jan 1, 1984
627.373 mln
+50.157 mln
8.69%
jan 1, 1985
701.58 mln
+74.208 mln
11.83%
jan 1, 1986
738.386 mln
+36.805 mln
5.25%
jan 1, 1987
938.544 mln
+200.158 mln
27.11%
jan 1, 1988
1.188 bln
+249.367 mln
26.57%
jan 1, 1989
1.412 bln
+223.703 mln
18.83%
jan 1, 1990
1.619 bln
+206.986 mln
14.66%
jan 1, 1991
2.004 bln
+384.98 mln
23.78%
jan 1, 1992
1.857 bln
-146.459 mln
-7.31%
jan 1, 1993
2.521 bln
+664.297 mln
35.77%
jan 1, 1994
2.335 bln
-186.3 mln
-7.39%
jan 1, 1995
2.647 bln
+311.618 mln
13.34%
jan 1, 1996
3.378 bln
+730.876 mln
27.61%
jan 1, 1997
3.31 bln
-67.806 mln
-2.01%
jan 1, 1998
3.305 bln
-4.672 mln
-0.14%
jan 1, 1999
3.595 bln
+289.608 mln
8.76%
jan 1, 2000
3.947 bln
+352.23 mln
9.8%
jan 1, 2001
4.068 bln
+121.091 mln
3.07%
jan 1, 2002
4.34 bln
+271.976 mln
6.69%
jan 1, 2003
4.374 bln
+34.244 mln
0.79%
jan 1, 2004
5.114 bln
+739.972 mln
16.92%
jan 1, 2005
5.836 bln
+721.529 mln
14.11%
jan 1, 2006
6.001 bln
+165.39 mln
2.83%
jan 1, 2007
6.574 bln
+572.413 mln
9.54%
jan 1, 2008
8.3 bln
+1.726 bln
26.26%
jan 1, 2009
10.651 bln
+2.351 bln
28.33%
jan 1, 2010
9.296 bln
-1.355 bln
-12.72%
jan 1, 2011
9.261 bln
-34.992 mln
-0.38%
jan 1, 2012
10.337 bln
+1.077 bln
11.62%
jan 1, 2013
9.456 bln
-881.155 mln
-8.52%
jan 1, 2014
10.531 bln
+1.075 bln
11.37%
jan 1, 2015
10.758 bln
+227.002 mln
2.16%
jan 1, 2016
9.216 bln
-1.542 bln
-14.33%
Ranking of countries by current statistics by years


Comments: