29
/
en
AIzaSyAYiBZKx7MnpbEhh9jyipgxe19OcubqV5w
April 1, 2024
87954
Bolivia
BOL
true
2
1
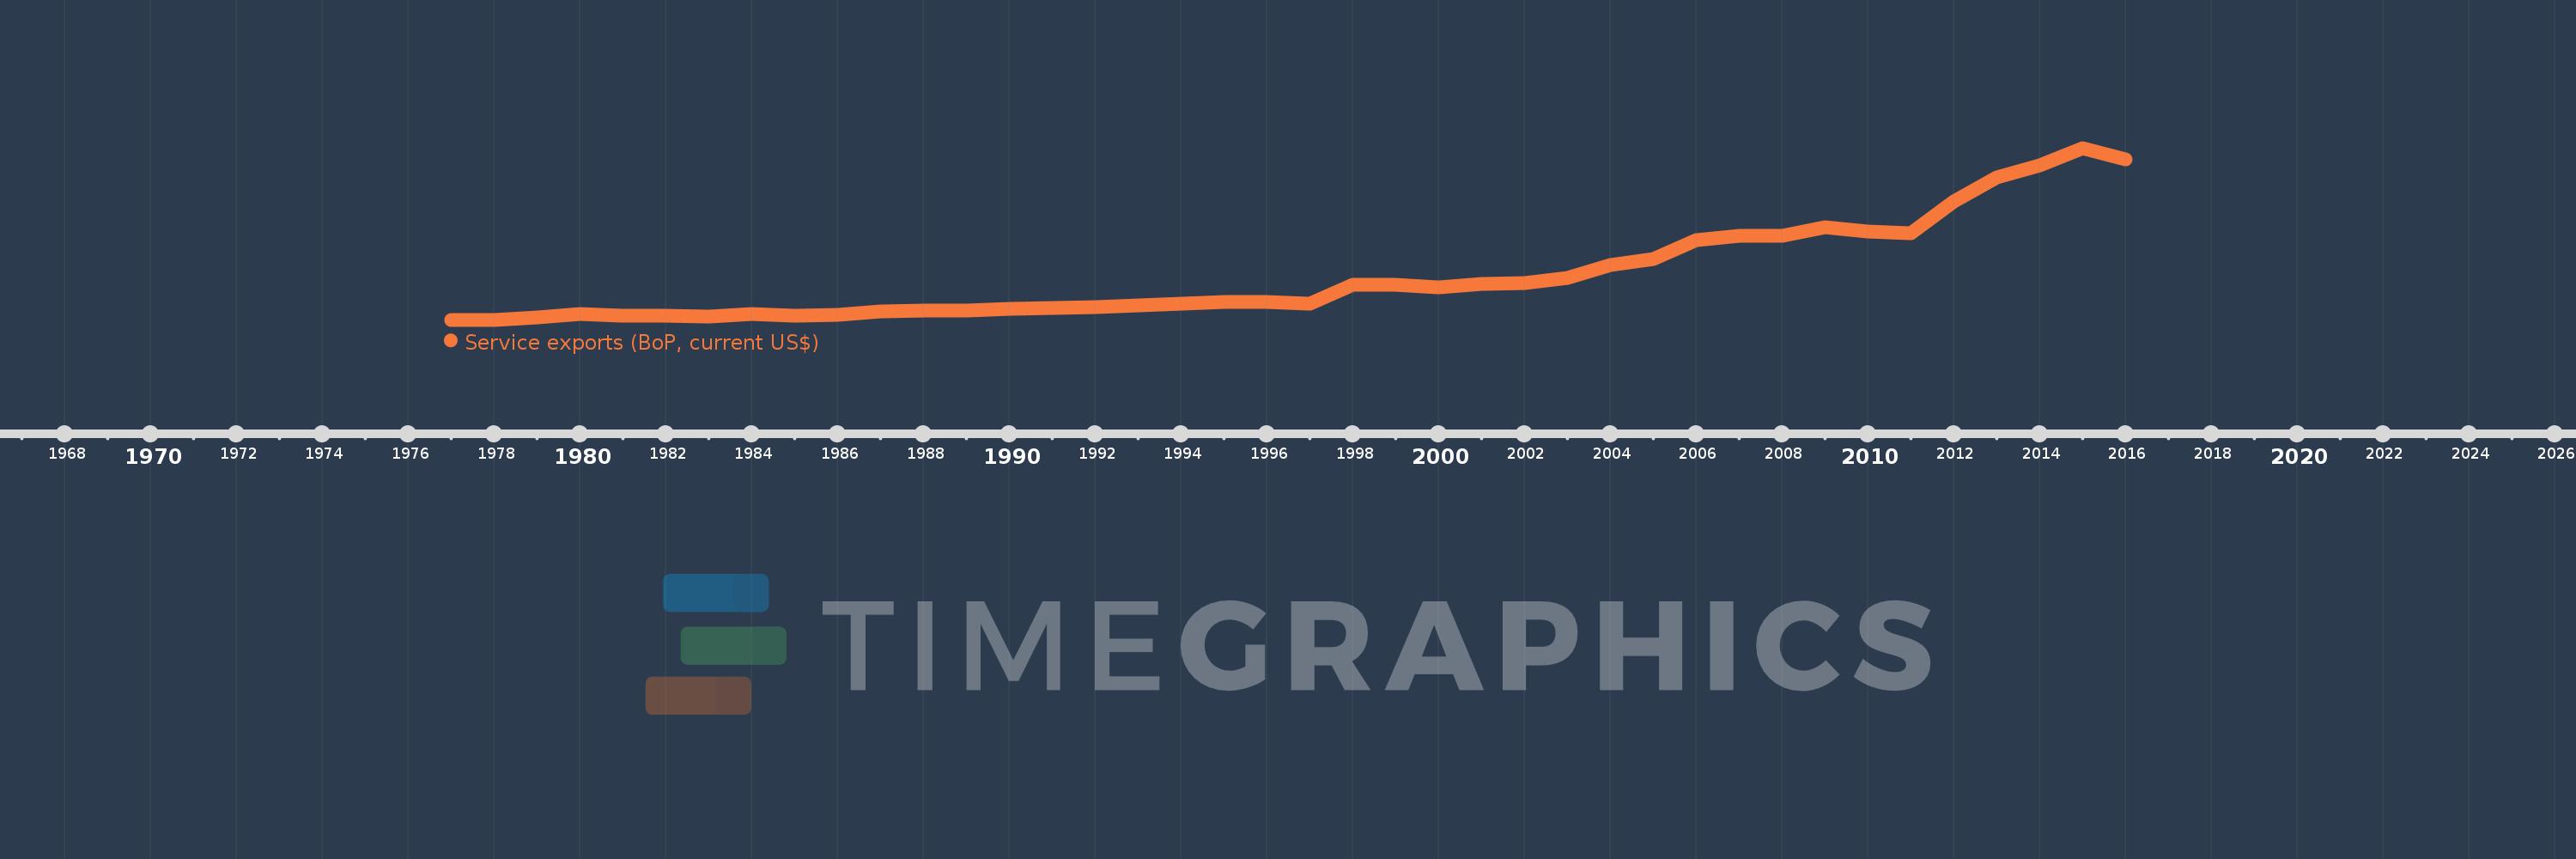
Service exports (BoP, current US$)
2016,2015,2014,2013,2012,2011,2010,2009,2008,2007,2006,2005,2004,2003,2002,2001,2000,1999,1998,1997,1996,1995,1994,1993,1992,1991,1990,1989,1988,1987,1986,1985,1984,1983,1982,1981,1980,1979,1978,1977
This statistics in other country:
AfghanistanAlbaniaAlgeriaAngolaAntigua and BarbudaArab WorldArgentinaArmeniaArubaAustraliaAustriaAzerbaijanBahamas, TheBahrainBangladeshBarbadosBelarusBelgiumBelizeBeninBermudaBhutanBoliviaBosnia and HerzegovinaBotswanaBrazilBrunei DarussalamBulgariaBurkina FasoBurundiCabo VerdeCambodiaCameroonCanadaCaribbean small statesCentral African RepublicCentral Europe and the BalticsChadChileChinaColombiaComorosCongo, Dem. Rep.Congo, Rep.Costa RicaCote d'IvoireCroatiaCuracaoCyprusCzech RepublicDenmarkDjiboutiDominicaDominican RepublicEarly-demographic dividendEast Asia & PacificEast Asia & Pacific (excluding high income)East Asia & Pacific (IDA & IBRD countries)EcuadorEgypt, Arab Rep.El SalvadorEquatorial GuineaEritreaEstoniaEthiopiaEuro areaEurope & Central AsiaEurope & Central Asia (excluding high income)Europe & Central Asia (IDA & IBRD countries)European UnionFaroe IslandsFijiFinlandFragile and conflict affected situationsFranceFrench PolynesiaGabonGambia, TheGeorgiaGermanyGhanaGreeceGrenadaGuatemalaGuineaGuinea-BissauGuyanaHaitiHeavily indebted poor countries (HIPC)High incomeHondurasHong Kong SAR, ChinaHungaryIBRD onlyIcelandIDA & IBRD totalIDA blendIDA onlyIDA totalIndiaIndonesiaIran, Islamic Rep.IraqIrelandIsraelItalyJamaicaJapanJordanKazakhstanKenyaKiribatiKorea, Rep.KosovoKuwaitKyrgyz RepublicLao PDRLate-demographic dividendLatin America & Caribbean Latin America & Caribbean (excluding high income)Latin America & the Caribbean (IDA & IBRD countries)LatviaLeast developed countries: UN classificationLebanonLesothoLiberiaLibyaLithuaniaLow & middle incomeLow incomeLower middle incomeLuxembourgMacao SAR, ChinaMacedonia, FYRMadagascarMalawiMalaysiaMaldivesMaliMaltaMarshall IslandsMauritaniaMauritiusMexicoMicronesia, Fed. Sts.Middle East & North Africa (excluding high income)Middle East & North Africa (IDA & IBRD countries)Middle incomeMoldovaMongoliaMontenegroMoroccoMozambiqueMyanmarNamibiaNepalNetherlandsNew CaledoniaNew ZealandNicaraguaNigerNigeriaNorth AmericaNorwayOECD membersOmanPacific island small statesPakistanPalauPanamaPapua New GuineaParaguayPeruPhilippinesPolandPortugalPost-demographic dividendPre-demographic dividendQatarRomaniaRussian FederationRwandaSamoaSao Tome and PrincipeSaudi ArabiaSenegalSerbiaSeychellesSierra LeoneSingaporeSint Maarten (Dutch part)Slovak RepublicSloveniaSolomon IslandsSouth AfricaSouth AsiaSouth Asia (IDA & IBRD)South SudanSpainSri LankaSt. Kitts and NevisSt. LuciaSt. Vincent and the GrenadinesSub-Saharan Africa Sub-Saharan Africa (excluding high income)Sub-Saharan Africa (IDA & IBRD countries)SudanSurinameSwazilandSwedenSwitzerlandSyrian Arab RepublicTajikistanTanzaniaThailandTimor-LesteTogoTongaTrinidad and TobagoTunisiaTurkeyTuvaluUgandaUkraineUnited KingdomUnited StatesUpper middle incomeUruguayVanuatuVenezuela, RBVietnamWest Bank and GazaWorldYemen, Rep.ZambiaZimbabwe Timeline:
This timeline shows a graph from 1977 to 2016 of Bolivia. No data until 1976. Number of actual observations by date: 40.
Source name:
World Development Indicators
Source organization:
International Monetary Fund, Balance of Payments Statistics Yearbook and data files.
Categories, topics:
Economy & Growth, Trade
Last updated:
apr 23, 2017
Indicators value changes by year
Minimum:
60.4 mln
jan 1, 1977
Maximum:
1.347 bln
jan 1, 2015
At the date of observation
Value
Absolute change
Change from previous value
jan 1, 1977
60.4 mln
+60.4 mln
0.0%
jan 1, 1978
60.8 mln
+400.0K
0.66%
jan 1, 1979
76.2 mln
+15.4 mln
25.33%
jan 1, 1980
105.2 mln
+29.0 mln
38.06%
jan 1, 1981
87.9 mln
-17.3 mln
-16.44%
jan 1, 1982
93.0 mln
+5.1 mln
5.8%
jan 1, 1983
82.3 mln
-10.7 mln
-11.51%
jan 1, 1984
103.0 mln
+20.7 mln
25.15%
jan 1, 1985
93.5 mln
-9.5 mln
-9.22%
jan 1, 1986
96.5 mln
+3.0 mln
3.21%
jan 1, 1987
121.1 mln
+24.6 mln
25.49%
jan 1, 1988
131.5 mln
+10.4 mln
8.59%
jan 1, 1989
128.3 mln
-3.2 mln
-2.43%
jan 1, 1990
143.3 mln
+15.0 mln
11.69%
jan 1, 1991
145.9 mln
+2.6 mln
1.81%
jan 1, 1992
157.0 mln
+11.1 mln
7.61%
jan 1, 1993
164.6 mln
+7.6 mln
4.84%
jan 1, 1994
181.4 mln
+16.8 mln
10.21%
jan 1, 1995
196.0 mln
+14.6 mln
8.05%
jan 1, 1996
192.4 mln
-3.6 mln
-1.84%
jan 1, 1997
180.94 mln
-11.46 mln
-5.96%
jan 1, 1998
323.84 mln
+142.9 mln
78.98%
jan 1, 1999
323.2 mln
-640.0K
-0.2%
jan 1, 2000
305.1 mln
-18.1 mln
-5.6%
jan 1, 2001
330.932 mln
+25.832 mln
8.47%
jan 1, 2002
332.041 mln
+1.109 mln
0.34%
jan 1, 2003
370.971 mln
+38.93 mln
11.72%
jan 1, 2004
468.545 mln
+97.575 mln
26.3%
jan 1, 2005
517.759 mln
+49.213 mln
10.5%
jan 1, 2006
657.166 mln
+139.408 mln
26.93%
jan 1, 2007
687.4 mln
+30.233 mln
4.6%
jan 1, 2008
691.909 mln
+4.509 mln
0.66%
jan 1, 2009
751.627 mln
+59.718 mln
8.63%
jan 1, 2010
720.13 mln
-31.497 mln
-4.19%
jan 1, 2011
707.694 mln
-12.436 mln
-1.73%
jan 1, 2012
948.038 mln
+240.344 mln
33.96%
jan 1, 2013
1.125 bln
+177.129 mln
18.68%
jan 1, 2014
1.214 bln
+88.787 mln
7.89%
jan 1, 2015
1.347 bln
+132.815 mln
10.94%
jan 1, 2016
1.262 bln
-84.447 mln
-6.27%
Ranking of countries by current statistics by years


Comments: