29
/
en
AIzaSyAYiBZKx7MnpbEhh9jyipgxe19OcubqV5w
April 1, 2024
62194
Upper middle income
UMC
false
2
1
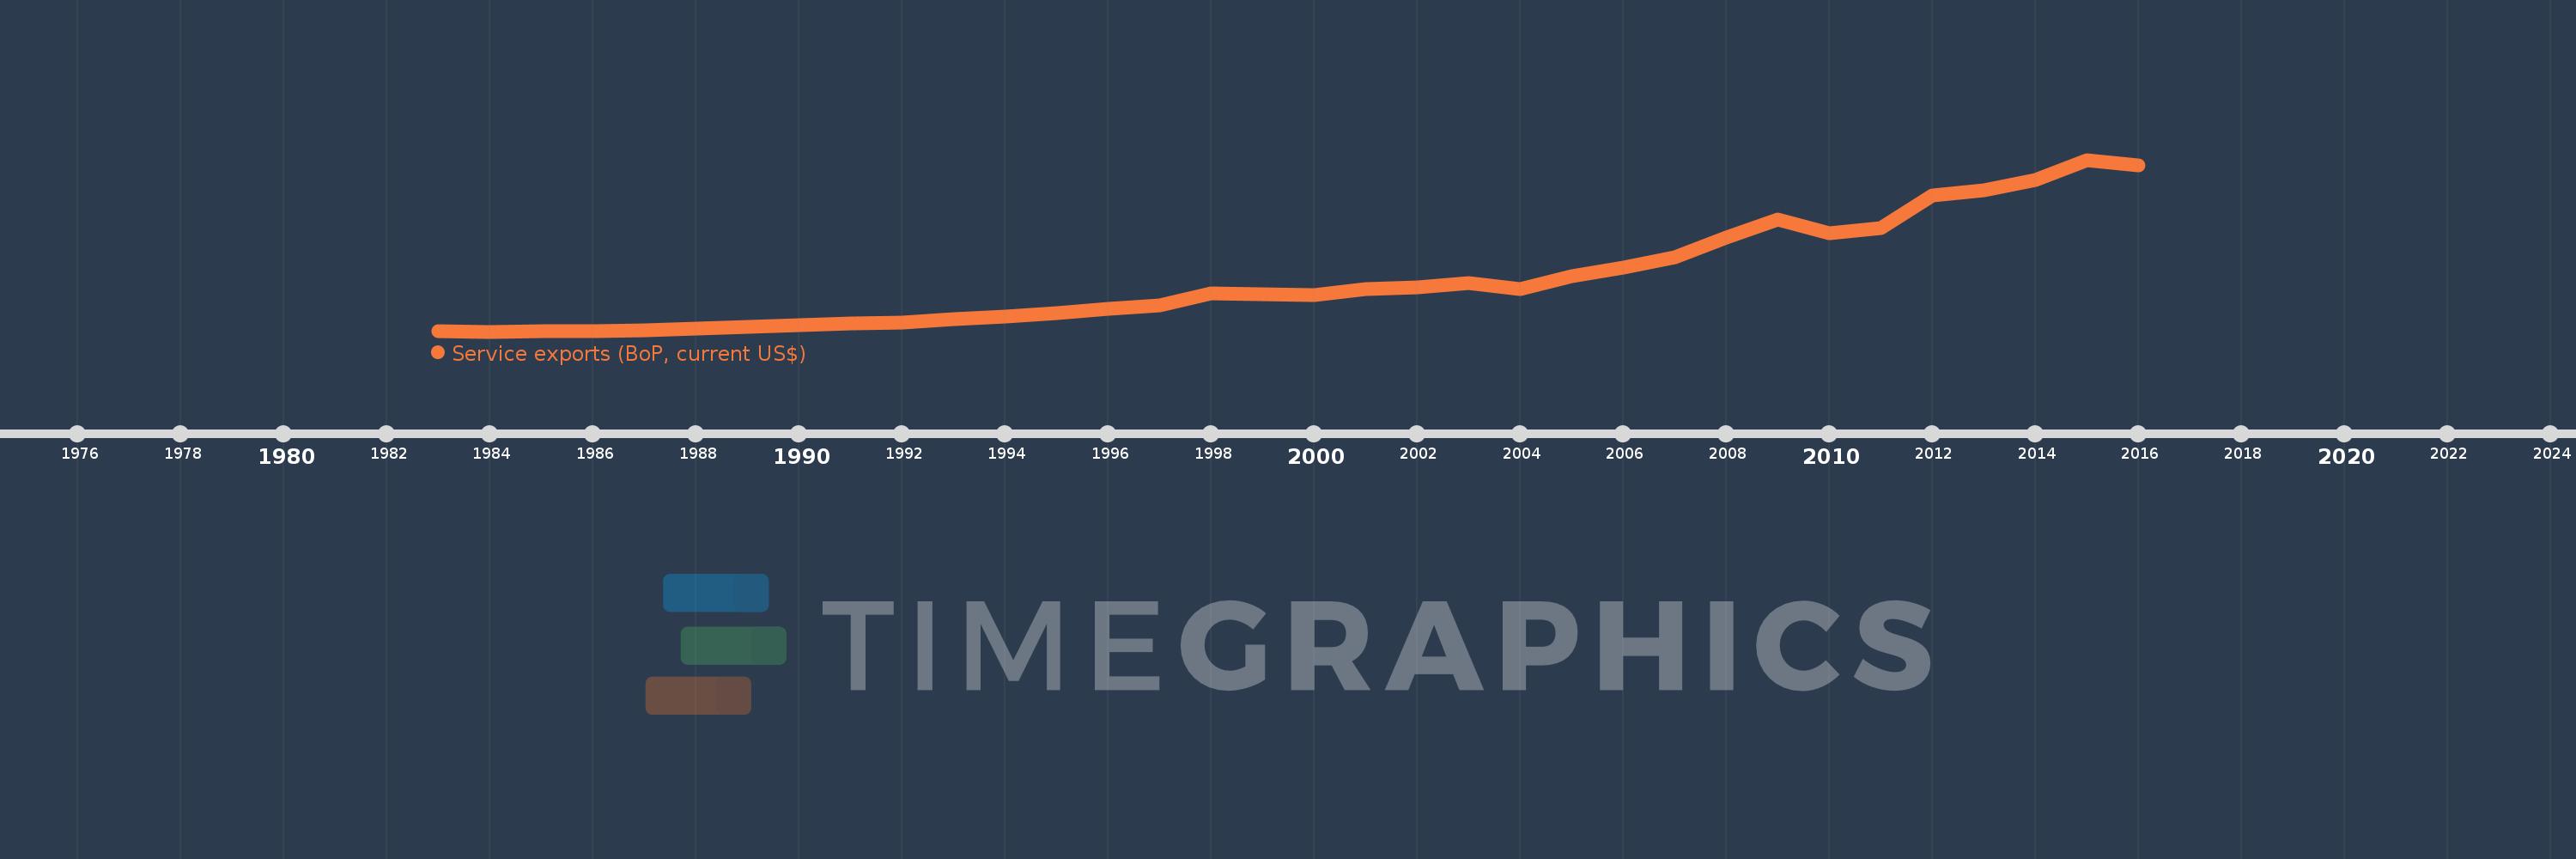
Service exports (BoP, current US$)
2016,2015,2014,2013,2012,2011,2010,2009,2008,2007,2006,2005,2004,2003,2002,2001,2000,1999,1998,1997,1996,1995,1994,1993,1992,1991,1990,1989,1988,1987,1986,1985,1984,1983
This statistics in other country:
AfghanistanAlbaniaAlgeriaAngolaAntigua and BarbudaArab WorldArgentinaArmeniaArubaAustraliaAustriaAzerbaijanBahamas, TheBahrainBangladeshBarbadosBelarusBelgiumBelizeBeninBermudaBhutanBoliviaBosnia and HerzegovinaBotswanaBrazilBrunei DarussalamBulgariaBurkina FasoBurundiCabo VerdeCambodiaCameroonCanadaCaribbean small statesCentral African RepublicCentral Europe and the BalticsChadChileChinaColombiaComorosCongo, Dem. Rep.Congo, Rep.Costa RicaCote d'IvoireCroatiaCuracaoCyprusCzech RepublicDenmarkDjiboutiDominicaDominican RepublicEarly-demographic dividendEast Asia & PacificEast Asia & Pacific (excluding high income)East Asia & Pacific (IDA & IBRD countries)EcuadorEgypt, Arab Rep.El SalvadorEquatorial GuineaEritreaEstoniaEthiopiaEuro areaEurope & Central AsiaEurope & Central Asia (excluding high income)Europe & Central Asia (IDA & IBRD countries)European UnionFaroe IslandsFijiFinlandFragile and conflict affected situationsFranceFrench PolynesiaGabonGambia, TheGeorgiaGermanyGhanaGreeceGrenadaGuatemalaGuineaGuinea-BissauGuyanaHaitiHeavily indebted poor countries (HIPC)High incomeHondurasHong Kong SAR, ChinaHungaryIBRD onlyIcelandIDA & IBRD totalIDA blendIDA onlyIDA totalIndiaIndonesiaIran, Islamic Rep.IraqIrelandIsraelItalyJamaicaJapanJordanKazakhstanKenyaKiribatiKorea, Rep.KosovoKuwaitKyrgyz RepublicLao PDRLate-demographic dividendLatin America & Caribbean Latin America & Caribbean (excluding high income)Latin America & the Caribbean (IDA & IBRD countries)LatviaLeast developed countries: UN classificationLebanonLesothoLiberiaLibyaLithuaniaLow & middle incomeLow incomeLower middle incomeLuxembourgMacao SAR, ChinaMacedonia, FYRMadagascarMalawiMalaysiaMaldivesMaliMaltaMarshall IslandsMauritaniaMauritiusMexicoMicronesia, Fed. Sts.Middle East & North Africa (excluding high income)Middle East & North Africa (IDA & IBRD countries)Middle incomeMoldovaMongoliaMontenegroMoroccoMozambiqueMyanmarNamibiaNepalNetherlandsNew CaledoniaNew ZealandNicaraguaNigerNigeriaNorth AmericaNorwayOECD membersOmanPacific island small statesPakistanPalauPanamaPapua New GuineaParaguayPeruPhilippinesPolandPortugalPost-demographic dividendPre-demographic dividendQatarRomaniaRussian FederationRwandaSamoaSao Tome and PrincipeSaudi ArabiaSenegalSerbiaSeychellesSierra LeoneSingaporeSint Maarten (Dutch part)Slovak RepublicSloveniaSolomon IslandsSouth AfricaSouth AsiaSouth Asia (IDA & IBRD)South SudanSpainSri LankaSt. Kitts and NevisSt. LuciaSt. Vincent and the GrenadinesSub-Saharan Africa Sub-Saharan Africa (excluding high income)Sub-Saharan Africa (IDA & IBRD countries)SudanSurinameSwazilandSwedenSwitzerlandSyrian Arab RepublicTajikistanTanzaniaThailandTimor-LesteTogoTongaTrinidad and TobagoTunisiaTurkeyTuvaluUgandaUkraineUnited KingdomUnited StatesUpper middle incomeUruguayVanuatuVenezuela, RBVietnamWest Bank and GazaWorldYemen, Rep.ZambiaZimbabwe Timeline:
This timeline shows a graph from 1983 to 2016 of Upper middle income. No data until 1982. Number of actual observations by date: 34.
Source name:
World Development Indicators
Source organization:
International Monetary Fund, Balance of Payments Statistics Yearbook and data files.
Categories, topics:
Economy & Growth, Trade
Last updated:
apr 23, 2017
Indicators value changes by year
Minimum:
34.466 bln
jan 1, 1984
Maximum:
764.388 bln
jan 1, 2015
At the date of observation
Value
Absolute change
Change from previous value
jan 1, 1983
34.684 bln
+34.684 bln
0.0%
jan 1, 1984
34.466 bln
-217.594 mln
-0.63%
jan 1, 1985
36.662 bln
+2.196 bln
6.37%
jan 1, 1986
37.576 bln
+914.114 mln
2.49%
jan 1, 1987
38.995 bln
+1.419 bln
3.78%
jan 1, 1988
45.442 bln
+6.447 bln
16.53%
jan 1, 1989
53.581 bln
+8.139 bln
17.91%
jan 1, 1990
60.33 bln
+6.749 bln
12.6%
jan 1, 1991
70.273 bln
+9.943 bln
16.48%
jan 1, 1992
74.566 bln
+4.293 bln
6.11%
jan 1, 1993
86.627 bln
+12.061 bln
16.18%
jan 1, 1994
98.479 bln
+11.852 bln
13.68%
jan 1, 1995
112.803 bln
+14.324 bln
14.54%
jan 1, 1996
131.349 bln
+18.546 bln
16.44%
jan 1, 1997
144.811 bln
+13.462 bln
10.25%
jan 1, 1998
197.771 bln
+52.96 bln
36.57%
jan 1, 1999
193.888 bln
-3.883 bln
-1.96%
jan 1, 2000
191.17 bln
-2.719 bln
-1.4%
jan 1, 2001
214.886 bln
+23.716 bln
12.41%
jan 1, 2002
222.691 bln
+7.805 bln
3.63%
jan 1, 2003
240.775 bln
+18.084 bln
8.12%
jan 1, 2004
216.716 bln
-24.059 bln
-9.99%
jan 1, 2005
269.94 bln
+53.224 bln
24.56%
jan 1, 2006
304.885 bln
+34.944 bln
12.95%
jan 1, 2007
351.686 bln
+46.801 bln
15.35%
jan 1, 2008
434.771 bln
+83.085 bln
23.62%
jan 1, 2009
509.797 bln
+75.027 bln
17.26%
jan 1, 2010
450.593 bln
-59.204 bln
-11.61%
jan 1, 2011
473.87 bln
+23.277 bln
5.17%
jan 1, 2012
611.597 bln
+137.727 bln
29.06%
jan 1, 2013
636.183 bln
+24.587 bln
4.02%
jan 1, 2014
679.999 bln
+43.816 bln
6.89%
jan 1, 2015
764.388 bln
+84.389 bln
12.41%
jan 1, 2016
739.801 bln
-24.587 bln
-3.22%
Ranking of countries by current statistics by years


Comments: