29
/
en
AIzaSyAYiBZKx7MnpbEhh9jyipgxe19OcubqV5w
April 1, 2024
28700
East Asia & Pacific (excluding high income)
EAP
false
2
1
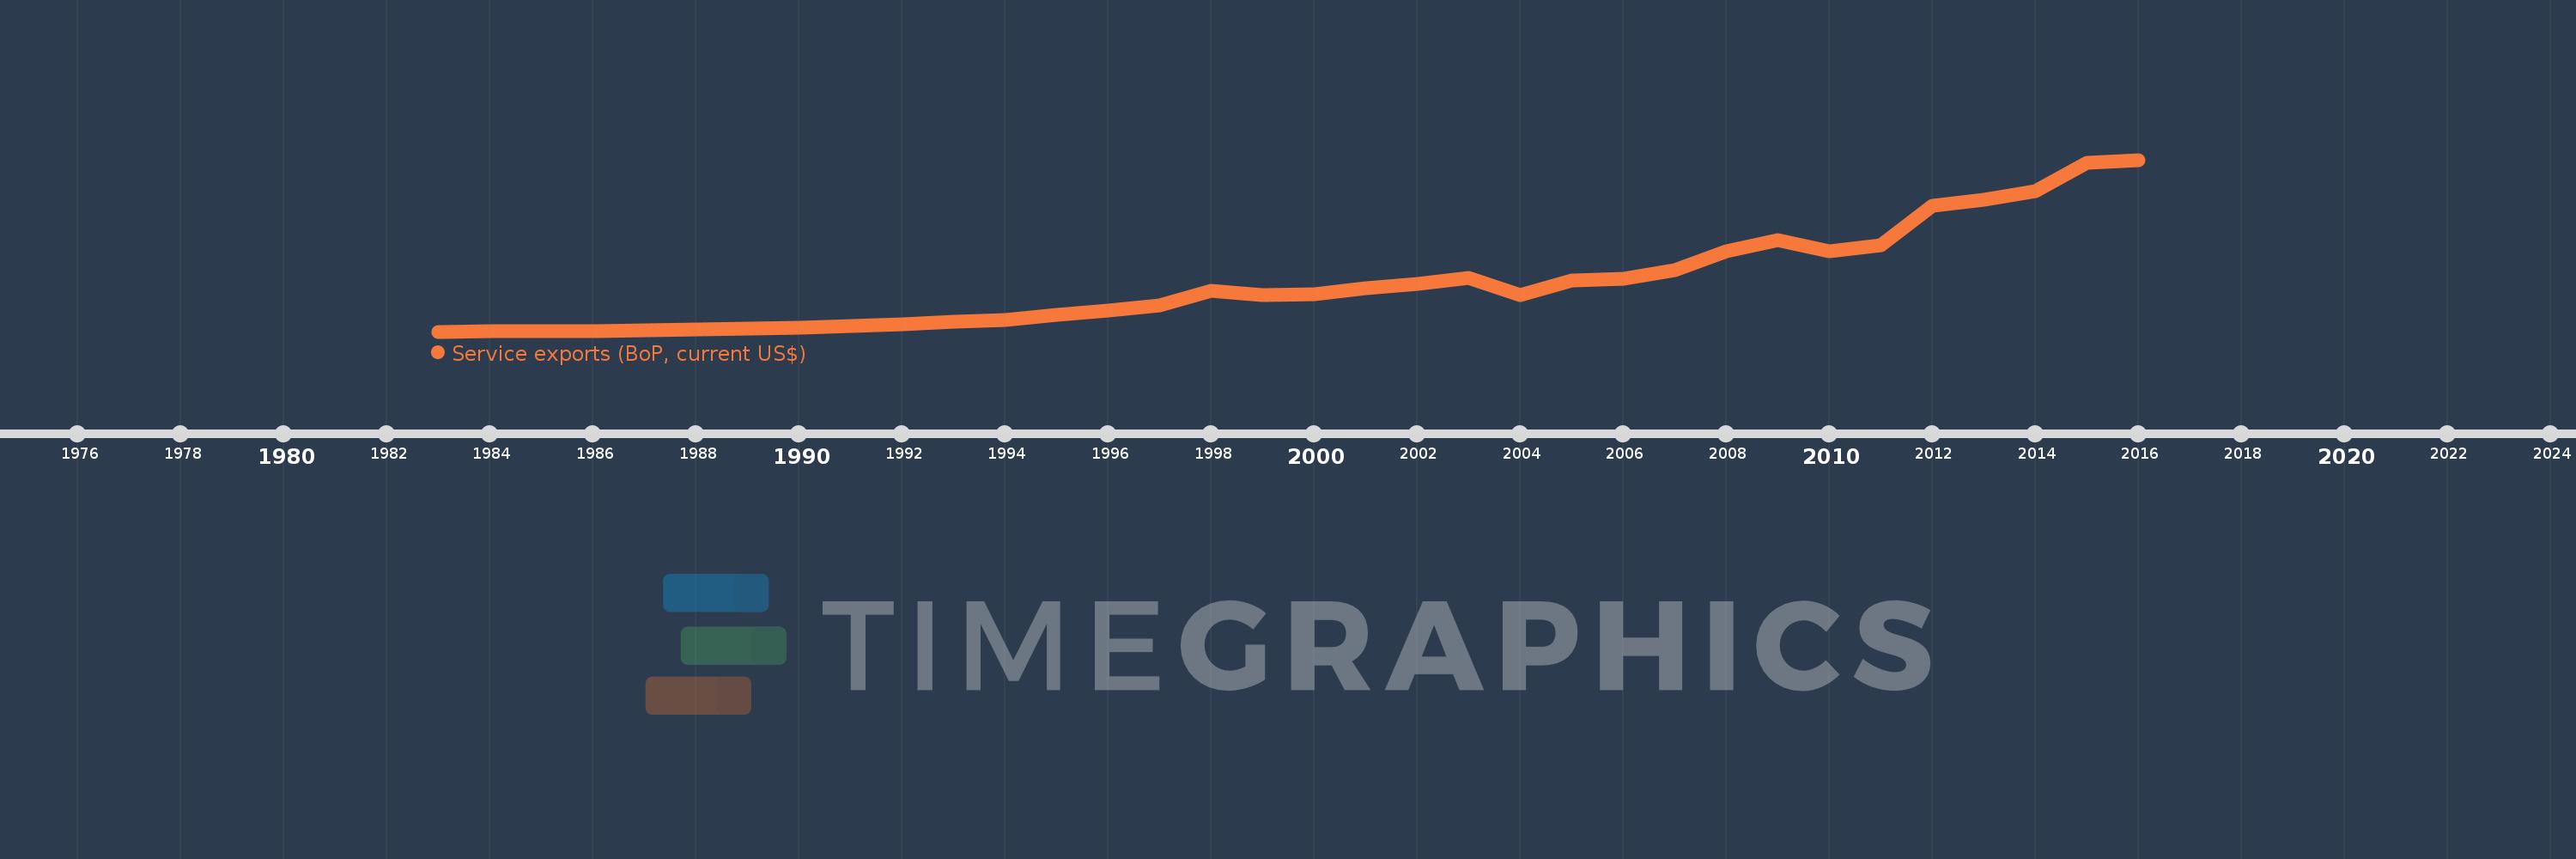
Service exports (BoP, current US$)
2016,2015,2014,2013,2012,2011,2010,2009,2008,2007,2006,2005,2004,2003,2002,2001,2000,1999,1998,1997,1996,1995,1994,1993,1992,1991,1990,1989,1988,1987,1986,1985,1984,1983
This statistics in other country:
AfghanistanAlbaniaAlgeriaAngolaAntigua and BarbudaArab WorldArgentinaArmeniaArubaAustraliaAustriaAzerbaijanBahamas, TheBahrainBangladeshBarbadosBelarusBelgiumBelizeBeninBermudaBhutanBoliviaBosnia and HerzegovinaBotswanaBrazilBrunei DarussalamBulgariaBurkina FasoBurundiCabo VerdeCambodiaCameroonCanadaCaribbean small statesCentral African RepublicCentral Europe and the BalticsChadChileChinaColombiaComorosCongo, Dem. Rep.Congo, Rep.Costa RicaCote d'IvoireCroatiaCuracaoCyprusCzech RepublicDenmarkDjiboutiDominicaDominican RepublicEarly-demographic dividendEast Asia & PacificEast Asia & Pacific (excluding high income)East Asia & Pacific (IDA & IBRD countries)EcuadorEgypt, Arab Rep.El SalvadorEquatorial GuineaEritreaEstoniaEthiopiaEuro areaEurope & Central AsiaEurope & Central Asia (excluding high income)Europe & Central Asia (IDA & IBRD countries)European UnionFaroe IslandsFijiFinlandFragile and conflict affected situationsFranceFrench PolynesiaGabonGambia, TheGeorgiaGermanyGhanaGreeceGrenadaGuatemalaGuineaGuinea-BissauGuyanaHaitiHeavily indebted poor countries (HIPC)High incomeHondurasHong Kong SAR, ChinaHungaryIBRD onlyIcelandIDA & IBRD totalIDA blendIDA onlyIDA totalIndiaIndonesiaIran, Islamic Rep.IraqIrelandIsraelItalyJamaicaJapanJordanKazakhstanKenyaKiribatiKorea, Rep.KosovoKuwaitKyrgyz RepublicLao PDRLate-demographic dividendLatin America & Caribbean Latin America & Caribbean (excluding high income)Latin America & the Caribbean (IDA & IBRD countries)LatviaLeast developed countries: UN classificationLebanonLesothoLiberiaLibyaLithuaniaLow & middle incomeLow incomeLower middle incomeLuxembourgMacao SAR, ChinaMacedonia, FYRMadagascarMalawiMalaysiaMaldivesMaliMaltaMarshall IslandsMauritaniaMauritiusMexicoMicronesia, Fed. Sts.Middle East & North Africa (excluding high income)Middle East & North Africa (IDA & IBRD countries)Middle incomeMoldovaMongoliaMontenegroMoroccoMozambiqueMyanmarNamibiaNepalNetherlandsNew CaledoniaNew ZealandNicaraguaNigerNigeriaNorth AmericaNorwayOECD membersOmanPacific island small statesPakistanPalauPanamaPapua New GuineaParaguayPeruPhilippinesPolandPortugalPost-demographic dividendPre-demographic dividendQatarRomaniaRussian FederationRwandaSamoaSao Tome and PrincipeSaudi ArabiaSenegalSerbiaSeychellesSierra LeoneSingaporeSint Maarten (Dutch part)Slovak RepublicSloveniaSolomon IslandsSouth AfricaSouth AsiaSouth Asia (IDA & IBRD)South SudanSpainSri LankaSt. Kitts and NevisSt. LuciaSt. Vincent and the GrenadinesSub-Saharan Africa Sub-Saharan Africa (excluding high income)Sub-Saharan Africa (IDA & IBRD countries)SudanSurinameSwazilandSwedenSwitzerlandSyrian Arab RepublicTajikistanTanzaniaThailandTimor-LesteTogoTongaTrinidad and TobagoTunisiaTurkeyTuvaluUgandaUkraineUnited KingdomUnited StatesUpper middle incomeUruguayVanuatuVenezuela, RBVietnamWest Bank and GazaWorldYemen, Rep.ZambiaZimbabwe Timeline:
This timeline shows a graph from 1983 to 2016 of East Asia & Pacific (excluding high income). No data until 1982. Number of actual observations by date: 34.
Source name:
World Development Indicators
Source organization:
International Monetary Fund, Balance of Payments Statistics Yearbook and data files.
Categories, topics:
Economy & Growth, Trade
Last updated:
apr 23, 2017
Indicators value changes by year
Minimum:
8.957 bln
jan 1, 1983
Maximum:
457.894 bln
jan 1, 2016
At the date of observation
Value
Absolute change
Change from previous value
jan 1, 1983
8.957 bln
+8.957 bln
0.0%
jan 1, 1984
9.373 bln
+416.048 mln
4.65%
jan 1, 1985
9.757 bln
+384.263 mln
4.1%
jan 1, 1986
11.042 bln
+1.285 bln
13.17%
jan 1, 1987
12.823 bln
+1.781 bln
16.13%
jan 1, 1988
14.233 bln
+1.41 bln
11.0%
jan 1, 1989
16.852 bln
+2.618 bln
18.4%
jan 1, 1990
19.442 bln
+2.59 bln
15.37%
jan 1, 1991
23.574 bln
+4.132 bln
21.25%
jan 1, 1992
26.953 bln
+3.379 bln
14.33%
jan 1, 1993
33.881 bln
+6.928 bln
25.7%
jan 1, 1994
39.948 bln
+6.067 bln
17.91%
jan 1, 1995
52.227 bln
+12.279 bln
30.74%
jan 1, 1996
64.138 bln
+11.911 bln
22.81%
jan 1, 1997
76.726 bln
+12.588 bln
19.63%
jan 1, 1998
116.195 bln
+39.469 bln
51.44%
jan 1, 1999
104.112 bln
-12.083 bln
-10.4%
jan 1, 2000
107.661 bln
+3.549 bln
3.41%
jan 1, 2001
122.99 bln
+15.329 bln
14.24%
jan 1, 2002
133.455 bln
+10.466 bln
8.51%
jan 1, 2003
150.31 bln
+16.855 bln
12.63%
jan 1, 2004
103.849 bln
-46.461 bln
-30.91%
jan 1, 2005
141.991 bln
+38.142 bln
36.73%
jan 1, 2006
147.854 bln
+5.863 bln
4.13%
jan 1, 2007
169.354 bln
+21.5 bln
14.54%
jan 1, 2008
219.942 bln
+50.588 bln
29.87%
jan 1, 2009
248.41 bln
+28.468 bln
12.94%
jan 1, 2010
217.902 bln
-30.508 bln
-12.28%
jan 1, 2011
234.245 bln
+16.343 bln
7.5%
jan 1, 2012
338.537 bln
+104.292 bln
44.52%
jan 1, 2013
354.344 bln
+15.807 bln
4.67%
jan 1, 2014
375.716 bln
+21.371 bln
6.03%
jan 1, 2015
449.454 bln
+73.738 bln
19.63%
jan 1, 2016
457.894 bln
+8.441 bln
1.88%
Ranking of countries by current statistics by years


Comments: