29
/
en
AIzaSyAYiBZKx7MnpbEhh9jyipgxe19OcubqV5w
April 1, 2024
234187
Sao Tome and Principe
STP
true
2
1
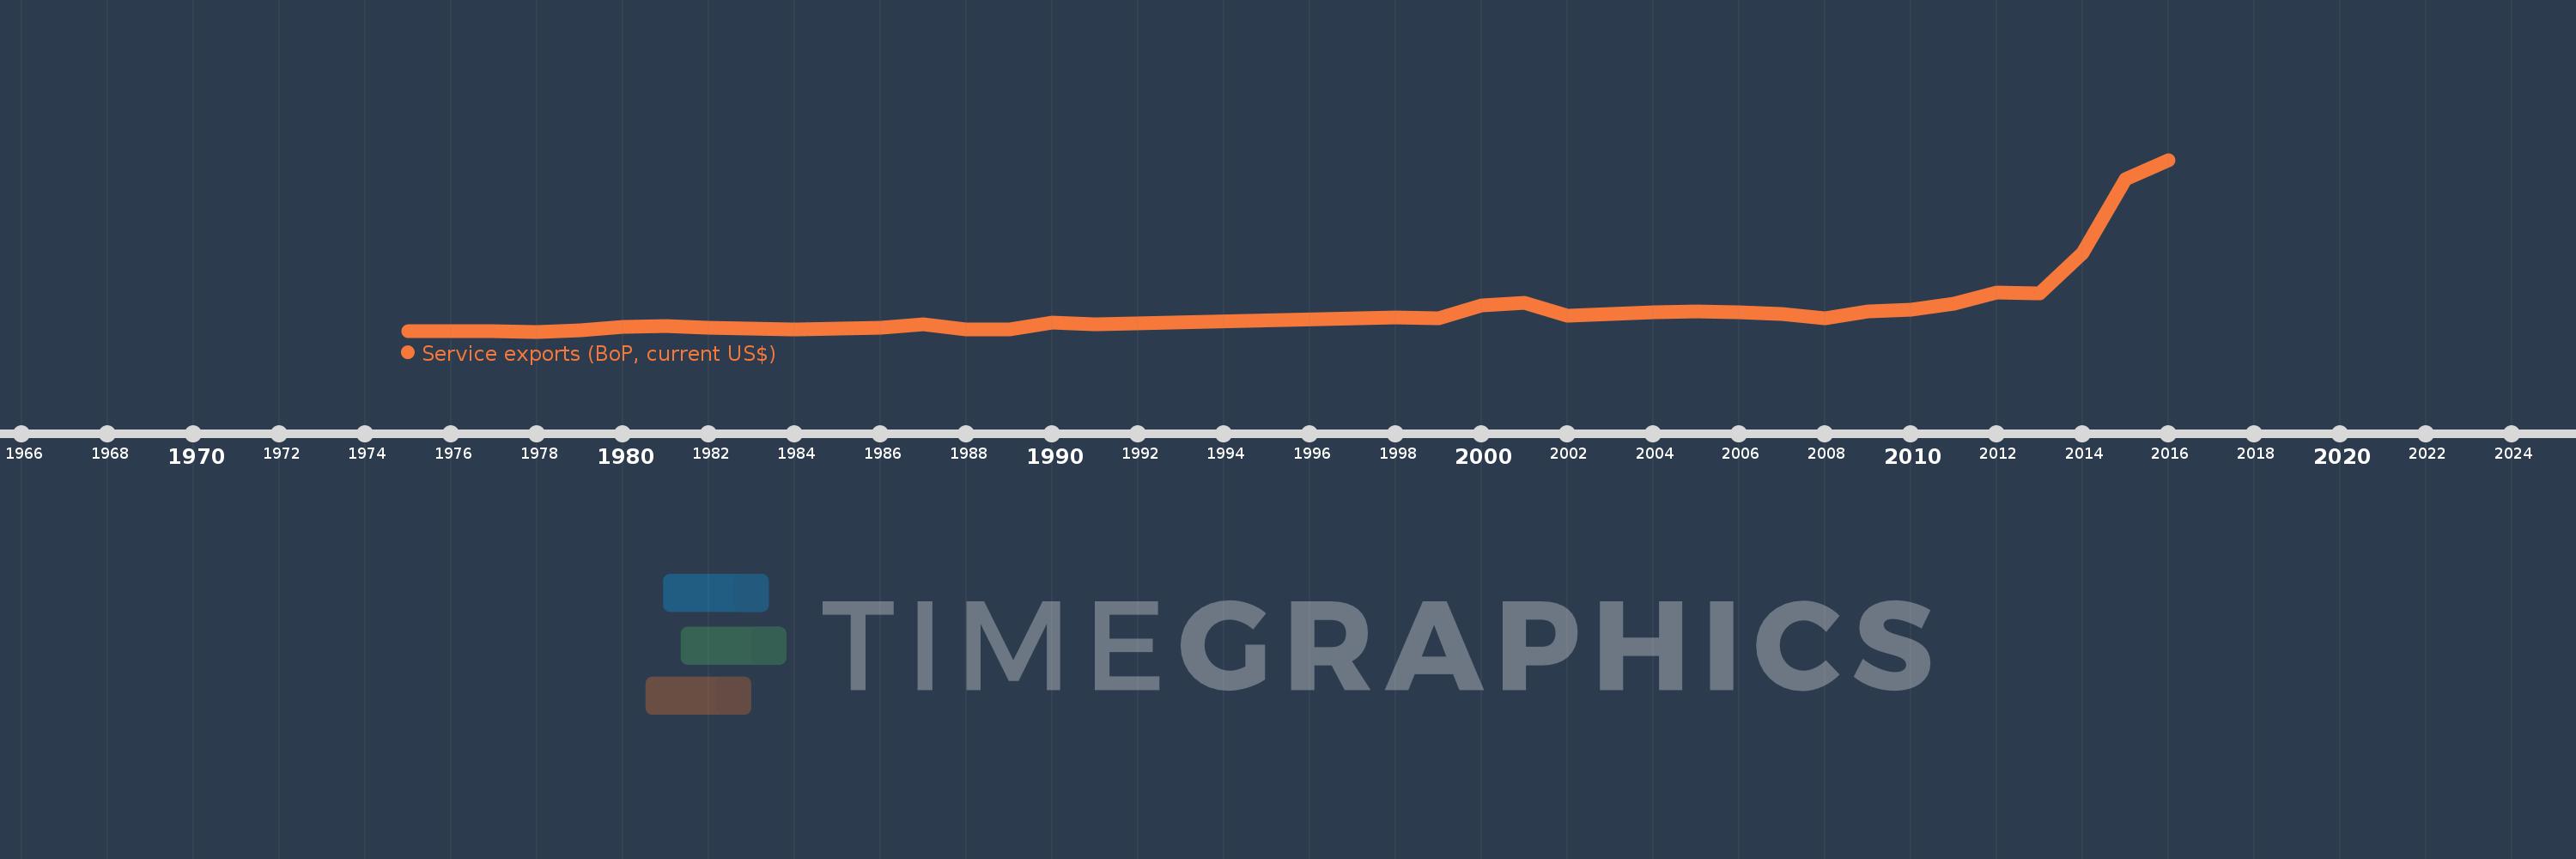
Service exports (BoP, current US$)
2016,2015,2014,2013,2012,2011,2010,2009,2008,2007,2006,2005,2004,2003,2002,2001,2000,1999,1998,1991,1990,1989,1988,1987,1986,1985,1984,1983,1982,1981,1980,1979,1978,1977,1976,1975
This statistics in other country:
AfghanistanAlbaniaAlgeriaAngolaAntigua and BarbudaArab WorldArgentinaArmeniaArubaAustraliaAustriaAzerbaijanBahamas, TheBahrainBangladeshBarbadosBelarusBelgiumBelizeBeninBermudaBhutanBoliviaBosnia and HerzegovinaBotswanaBrazilBrunei DarussalamBulgariaBurkina FasoBurundiCabo VerdeCambodiaCameroonCanadaCaribbean small statesCentral African RepublicCentral Europe and the BalticsChadChileChinaColombiaComorosCongo, Dem. Rep.Congo, Rep.Costa RicaCote d'IvoireCroatiaCuracaoCyprusCzech RepublicDenmarkDjiboutiDominicaDominican RepublicEarly-demographic dividendEast Asia & PacificEast Asia & Pacific (excluding high income)East Asia & Pacific (IDA & IBRD countries)EcuadorEgypt, Arab Rep.El SalvadorEquatorial GuineaEritreaEstoniaEthiopiaEuro areaEurope & Central AsiaEurope & Central Asia (excluding high income)Europe & Central Asia (IDA & IBRD countries)European UnionFaroe IslandsFijiFinlandFragile and conflict affected situationsFranceFrench PolynesiaGabonGambia, TheGeorgiaGermanyGhanaGreeceGrenadaGuatemalaGuineaGuinea-BissauGuyanaHaitiHeavily indebted poor countries (HIPC)High incomeHondurasHong Kong SAR, ChinaHungaryIBRD onlyIcelandIDA & IBRD totalIDA blendIDA onlyIDA totalIndiaIndonesiaIran, Islamic Rep.IraqIrelandIsraelItalyJamaicaJapanJordanKazakhstanKenyaKiribatiKorea, Rep.KosovoKuwaitKyrgyz RepublicLao PDRLate-demographic dividendLatin America & Caribbean Latin America & Caribbean (excluding high income)Latin America & the Caribbean (IDA & IBRD countries)LatviaLeast developed countries: UN classificationLebanonLesothoLiberiaLibyaLithuaniaLow & middle incomeLow incomeLower middle incomeLuxembourgMacao SAR, ChinaMacedonia, FYRMadagascarMalawiMalaysiaMaldivesMaliMaltaMarshall IslandsMauritaniaMauritiusMexicoMicronesia, Fed. Sts.Middle East & North Africa (excluding high income)Middle East & North Africa (IDA & IBRD countries)Middle incomeMoldovaMongoliaMontenegroMoroccoMozambiqueMyanmarNamibiaNepalNetherlandsNew CaledoniaNew ZealandNicaraguaNigerNigeriaNorth AmericaNorwayOECD membersOmanPacific island small statesPakistanPalauPanamaPapua New GuineaParaguayPeruPhilippinesPolandPortugalPost-demographic dividendPre-demographic dividendQatarRomaniaRussian FederationRwandaSamoaSao Tome and PrincipeSaudi ArabiaSenegalSerbiaSeychellesSierra LeoneSingaporeSint Maarten (Dutch part)Slovak RepublicSloveniaSolomon IslandsSouth AfricaSouth AsiaSouth Asia (IDA & IBRD)South SudanSpainSri LankaSt. Kitts and NevisSt. LuciaSt. Vincent and the GrenadinesSub-Saharan Africa Sub-Saharan Africa (excluding high income)Sub-Saharan Africa (IDA & IBRD countries)SudanSurinameSwazilandSwedenSwitzerlandSyrian Arab RepublicTajikistanTanzaniaThailandTimor-LesteTogoTongaTrinidad and TobagoTunisiaTurkeyTuvaluUgandaUkraineUnited KingdomUnited StatesUpper middle incomeUruguayVanuatuVenezuela, RBVietnamWest Bank and GazaWorldYemen, Rep.ZambiaZimbabwe Timeline:
This timeline shows a graph from 1975 to 2016 of Sao Tome and Principe. No data until 1974. Number of actual observations by date: 36.
Source name:
World Development Indicators
Source organization:
International Monetary Fund, Balance of Payments Statistics Yearbook and data files.
Categories, topics:
Economy & Growth, Trade
Last updated:
apr 23, 2017
Indicators value changes by year
Minimum:
489.567K
jan 1, 1978
Maximum:
78.761 mln
jan 1, 2016
At the date of observation
Value
Absolute change
Change from previous value
jan 1, 1975
516.667K
+516.667K
0.0%
jan 1, 1976
612.726K
+96.059K
18.59%
jan 1, 1977
511.11K
-101.615K
-16.58%
jan 1, 1978
489.567K
-21.543K
-4.22%
jan 1, 1979
1.171 mln
+681.896K
139.29%
jan 1, 1980
2.695 mln
+1.524 mln
130.08%
jan 1, 1981
2.982 mln
+287.086K
10.65%
jan 1, 1982
2.315 mln
-667.2K
-22.37%
jan 1, 1983
1.988 mln
-327.264K
-14.14%
jan 1, 1984
1.571 mln
-417.076K
-20.98%
jan 1, 1985
1.975 mln
+403.9K
25.71%
jan 1, 1986
2.137 mln
+161.864K
8.2%
jan 1, 1987
3.667 mln
+1.53 mln
71.62%
jan 1, 1988
1.656 mln
-2.01 mln
-54.83%
jan 1, 1989
1.546 mln
-110.331K
-6.66%
jan 1, 1990
4.484 mln
+2.938 mln
189.99%
jan 1, 1991
3.66 mln
-823.756K
-18.37%
jan 1, 1998
7.1 mln
+3.44 mln
94.0%
jan 1, 1999
6.563 mln
-537.066K
-7.56%
jan 1, 2000
12.475 mln
+5.912 mln
90.08%
jan 1, 2001
13.577 mln
+1.102 mln
8.83%
jan 1, 2002
7.779 mln
-5.799 mln
-42.71%
jan 1, 2003
8.594 mln
+815.288K
10.48%
jan 1, 2004
9.218 mln
+623.949K
7.26%
jan 1, 2005
9.63 mln
+411.579K
4.46%
jan 1, 2006
9.153 mln
-476.286K
-4.95%
jan 1, 2007
8.404 mln
-749.436K
-8.19%
jan 1, 2008
6.7 mln
-1.704 mln
-20.27%
jan 1, 2009
9.678 mln
+2.978 mln
44.44%
jan 1, 2010
10.407 mln
+728.702K
7.53%
jan 1, 2011
13.38 mln
+2.974 mln
28.58%
jan 1, 2012
18.398 mln
+5.018 mln
37.5%
jan 1, 2013
17.888 mln
-510.474K
-2.77%
jan 1, 2014
36.186 mln
+18.299 mln
102.3%
jan 1, 2015
69.939 mln
+33.752 mln
93.27%
jan 1, 2016
78.761 mln
+8.822 mln
12.61%
Ranking of countries by current statistics by years


Comments: