29
/
en
AIzaSyAYiBZKx7MnpbEhh9jyipgxe19OcubqV5w
April 1, 2024
134590
France
FRA
true
2
1
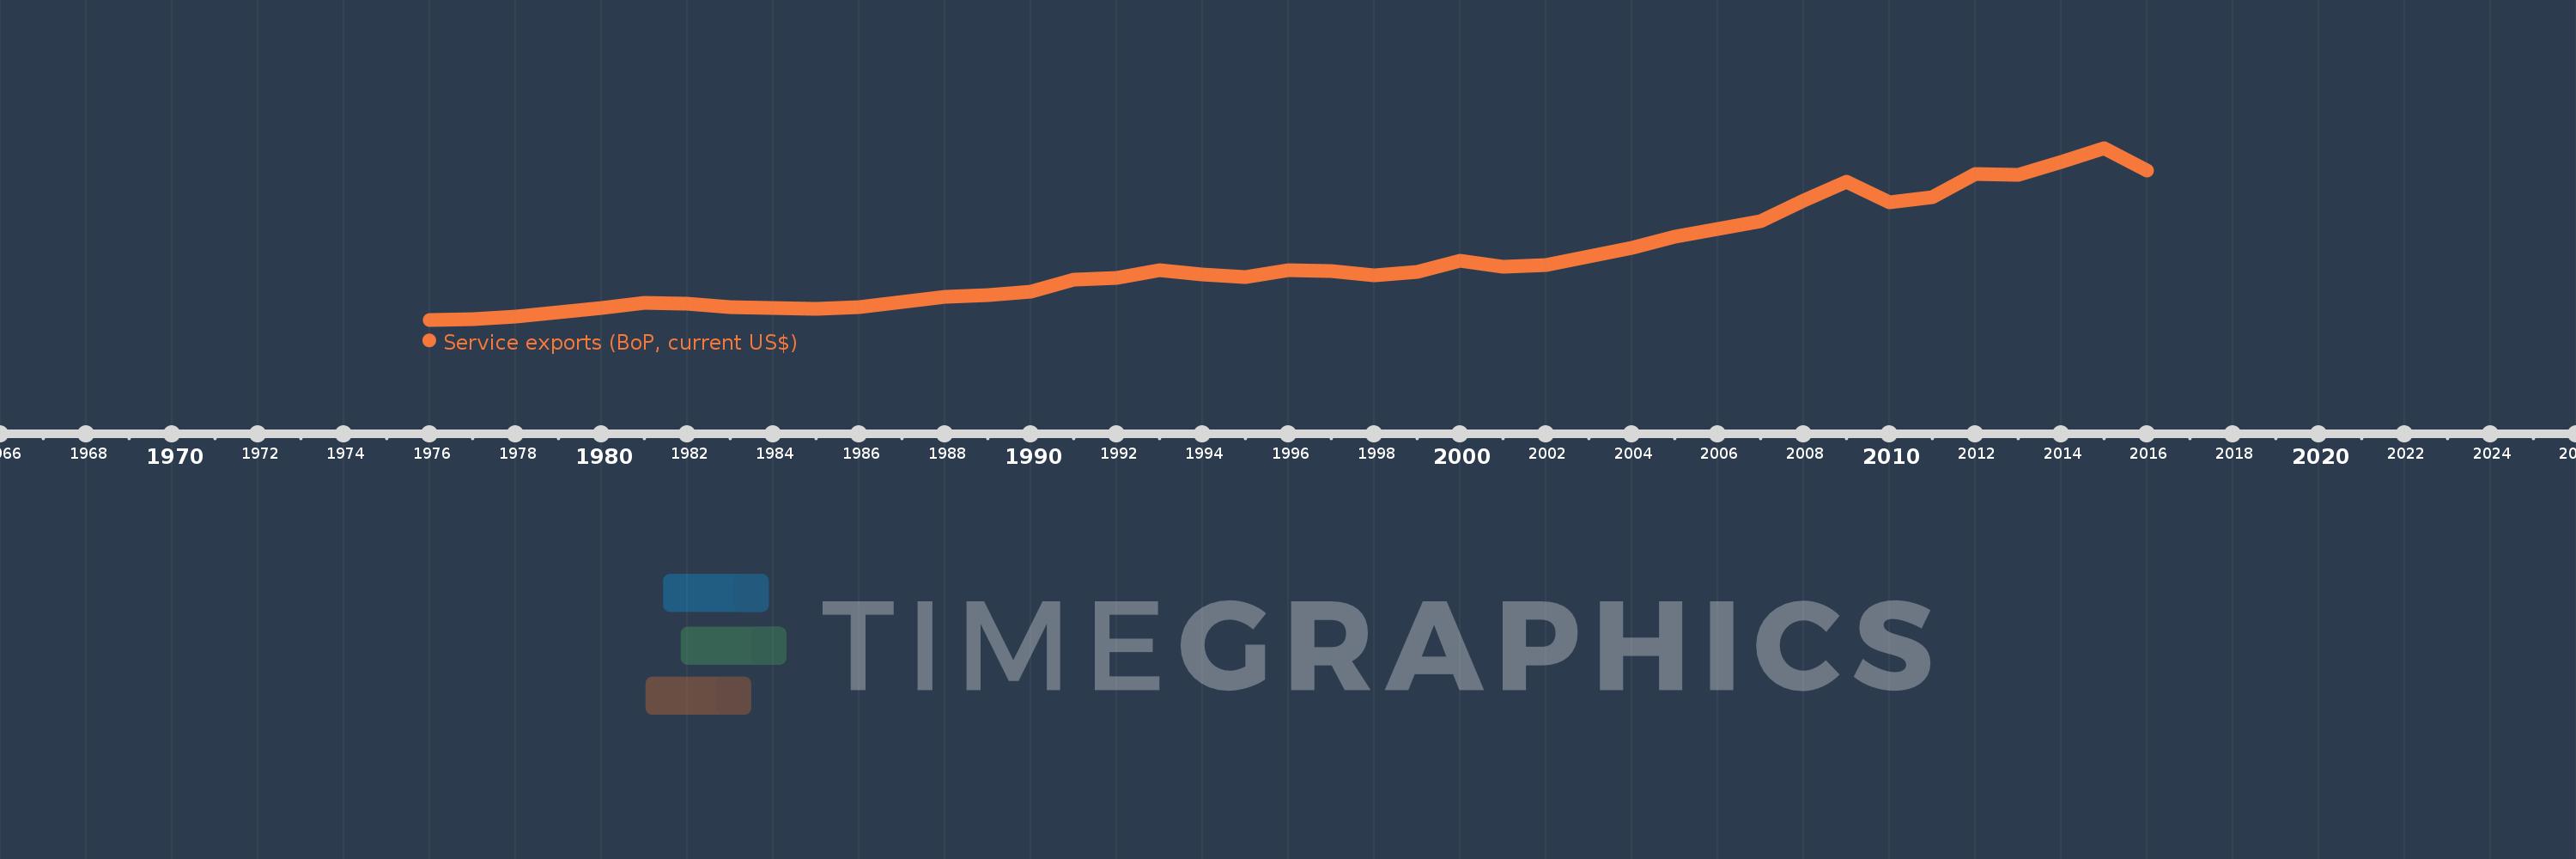
Service exports (BoP, current US$)
2016,2015,2014,2013,2012,2011,2010,2009,2008,2007,2006,2005,2004,2003,2002,2001,2000,1999,1998,1997,1996,1995,1994,1993,1992,1991,1990,1989,1988,1987,1986,1985,1984,1983,1982,1981,1980,1979,1978,1977,1976
This statistics in other country:
AfghanistanAlbaniaAlgeriaAngolaAntigua and BarbudaArab WorldArgentinaArmeniaArubaAustraliaAustriaAzerbaijanBahamas, TheBahrainBangladeshBarbadosBelarusBelgiumBelizeBeninBermudaBhutanBoliviaBosnia and HerzegovinaBotswanaBrazilBrunei DarussalamBulgariaBurkina FasoBurundiCabo VerdeCambodiaCameroonCanadaCaribbean small statesCentral African RepublicCentral Europe and the BalticsChadChileChinaColombiaComorosCongo, Dem. Rep.Congo, Rep.Costa RicaCote d'IvoireCroatiaCuracaoCyprusCzech RepublicDenmarkDjiboutiDominicaDominican RepublicEarly-demographic dividendEast Asia & PacificEast Asia & Pacific (excluding high income)East Asia & Pacific (IDA & IBRD countries)EcuadorEgypt, Arab Rep.El SalvadorEquatorial GuineaEritreaEstoniaEthiopiaEuro areaEurope & Central AsiaEurope & Central Asia (excluding high income)Europe & Central Asia (IDA & IBRD countries)European UnionFaroe IslandsFijiFinlandFragile and conflict affected situationsFranceFrench PolynesiaGabonGambia, TheGeorgiaGermanyGhanaGreeceGrenadaGuatemalaGuineaGuinea-BissauGuyanaHaitiHeavily indebted poor countries (HIPC)High incomeHondurasHong Kong SAR, ChinaHungaryIBRD onlyIcelandIDA & IBRD totalIDA blendIDA onlyIDA totalIndiaIndonesiaIran, Islamic Rep.IraqIrelandIsraelItalyJamaicaJapanJordanKazakhstanKenyaKiribatiKorea, Rep.KosovoKuwaitKyrgyz RepublicLao PDRLate-demographic dividendLatin America & Caribbean Latin America & Caribbean (excluding high income)Latin America & the Caribbean (IDA & IBRD countries)LatviaLeast developed countries: UN classificationLebanonLesothoLiberiaLibyaLithuaniaLow & middle incomeLow incomeLower middle incomeLuxembourgMacao SAR, ChinaMacedonia, FYRMadagascarMalawiMalaysiaMaldivesMaliMaltaMarshall IslandsMauritaniaMauritiusMexicoMicronesia, Fed. Sts.Middle East & North Africa (excluding high income)Middle East & North Africa (IDA & IBRD countries)Middle incomeMoldovaMongoliaMontenegroMoroccoMozambiqueMyanmarNamibiaNepalNetherlandsNew CaledoniaNew ZealandNicaraguaNigerNigeriaNorth AmericaNorwayOECD membersOmanPacific island small statesPakistanPalauPanamaPapua New GuineaParaguayPeruPhilippinesPolandPortugalPost-demographic dividendPre-demographic dividendQatarRomaniaRussian FederationRwandaSamoaSao Tome and PrincipeSaudi ArabiaSenegalSerbiaSeychellesSierra LeoneSingaporeSint Maarten (Dutch part)Slovak RepublicSloveniaSolomon IslandsSouth AfricaSouth AsiaSouth Asia (IDA & IBRD)South SudanSpainSri LankaSt. Kitts and NevisSt. LuciaSt. Vincent and the GrenadinesSub-Saharan Africa Sub-Saharan Africa (excluding high income)Sub-Saharan Africa (IDA & IBRD countries)SudanSurinameSwazilandSwedenSwitzerlandSyrian Arab RepublicTajikistanTanzaniaThailandTimor-LesteTogoTongaTrinidad and TobagoTunisiaTurkeyTuvaluUgandaUkraineUnited KingdomUnited StatesUpper middle incomeUruguayVanuatuVenezuela, RBVietnamWest Bank and GazaWorldYemen, Rep.ZambiaZimbabwe Timeline:
This timeline shows a graph from 1976 to 2016 of France. No data until 1975. Number of actual observations by date: 41.
Source name:
World Development Indicators
Source organization:
International Monetary Fund, Balance of Payments Statistics Yearbook and data files.
Categories, topics:
Economy & Growth, Trade
Last updated:
apr 23, 2017
Indicators value changes by year
Minimum:
17.97 bln
jan 1, 1976
Maximum:
274.977 bln
jan 1, 2015
At the date of observation
Value
Absolute change
Change from previous value
jan 1, 1976
17.97 bln
+17.97 bln
0.0%
jan 1, 1977
18.924 bln
+953.962 mln
5.31%
jan 1, 1978
22.55 bln
+3.626 bln
19.16%
jan 1, 1979
29.738 bln
+7.188 bln
31.87%
jan 1, 1980
35.525 bln
+5.787 bln
19.46%
jan 1, 1981
43.731 bln
+8.207 bln
23.1%
jan 1, 1982
42.281 bln
-1.45 bln
-3.32%
jan 1, 1983
36.681 bln
-5.6 bln
-13.25%
jan 1, 1984
35.329 bln
-1.352 bln
-3.69%
jan 1, 1985
34.749 bln
-579.576 mln
-1.64%
jan 1, 1986
36.54 bln
+1.79 bln
5.15%
jan 1, 1987
44.847 bln
+8.307 bln
22.74%
jan 1, 1988
52.322 bln
+7.475 bln
16.67%
jan 1, 1989
55.449 bln
+3.127 bln
5.98%
jan 1, 1990
60.473 bln
+5.023 bln
9.06%
jan 1, 1991
77.669 bln
+17.196 bln
28.44%
jan 1, 1992
80.655 bln
+2.986 bln
3.84%
jan 1, 1993
92.337 bln
+11.682 bln
14.48%
jan 1, 1994
86.181 bln
-6.156 bln
-6.67%
jan 1, 1995
81.822 bln
-4.359 bln
-5.06%
jan 1, 1996
92.121 bln
+10.299 bln
12.59%
jan 1, 1997
91.05 bln
-1.072 bln
-1.16%
jan 1, 1998
84.78 bln
-6.269 bln
-6.89%
jan 1, 1999
90.046 bln
+5.265 bln
6.21%
jan 1, 2000
106.295 bln
+16.25 bln
18.05%
jan 1, 2001
96.658 bln
-9.638 bln
-9.07%
jan 1, 2002
100.34 bln
+3.682 bln
3.81%
jan 1, 2003
112.868 bln
+12.528 bln
12.49%
jan 1, 2004
125.965 bln
+13.097 bln
11.6%
jan 1, 2005
142.757 bln
+16.792 bln
13.33%
jan 1, 2006
153.266 bln
+10.509 bln
7.36%
jan 1, 2007
165.421 bln
+12.155 bln
7.93%
jan 1, 2008
196.822 bln
+31.401 bln
18.98%
jan 1, 2009
224.319 bln
+27.497 bln
13.97%
jan 1, 2010
194.002 bln
-30.317 bln
-13.52%
jan 1, 2011
201.702 bln
+7.699 bln
3.97%
jan 1, 2012
236.678 bln
+34.977 bln
17.34%
jan 1, 2013
234.401 bln
-2.278 bln
-0.96%
jan 1, 2014
254.231 bln
+19.831 bln
8.46%
jan 1, 2015
274.977 bln
+20.745 bln
8.16%
jan 1, 2016
241.468 bln
-33.508 bln
-12.19%
Ranking of countries by current statistics by years


Comments: