29
/
en
AIzaSyAYiBZKx7MnpbEhh9jyipgxe19OcubqV5w
April 1, 2024
231726
Rwanda
RWA
true
2
1
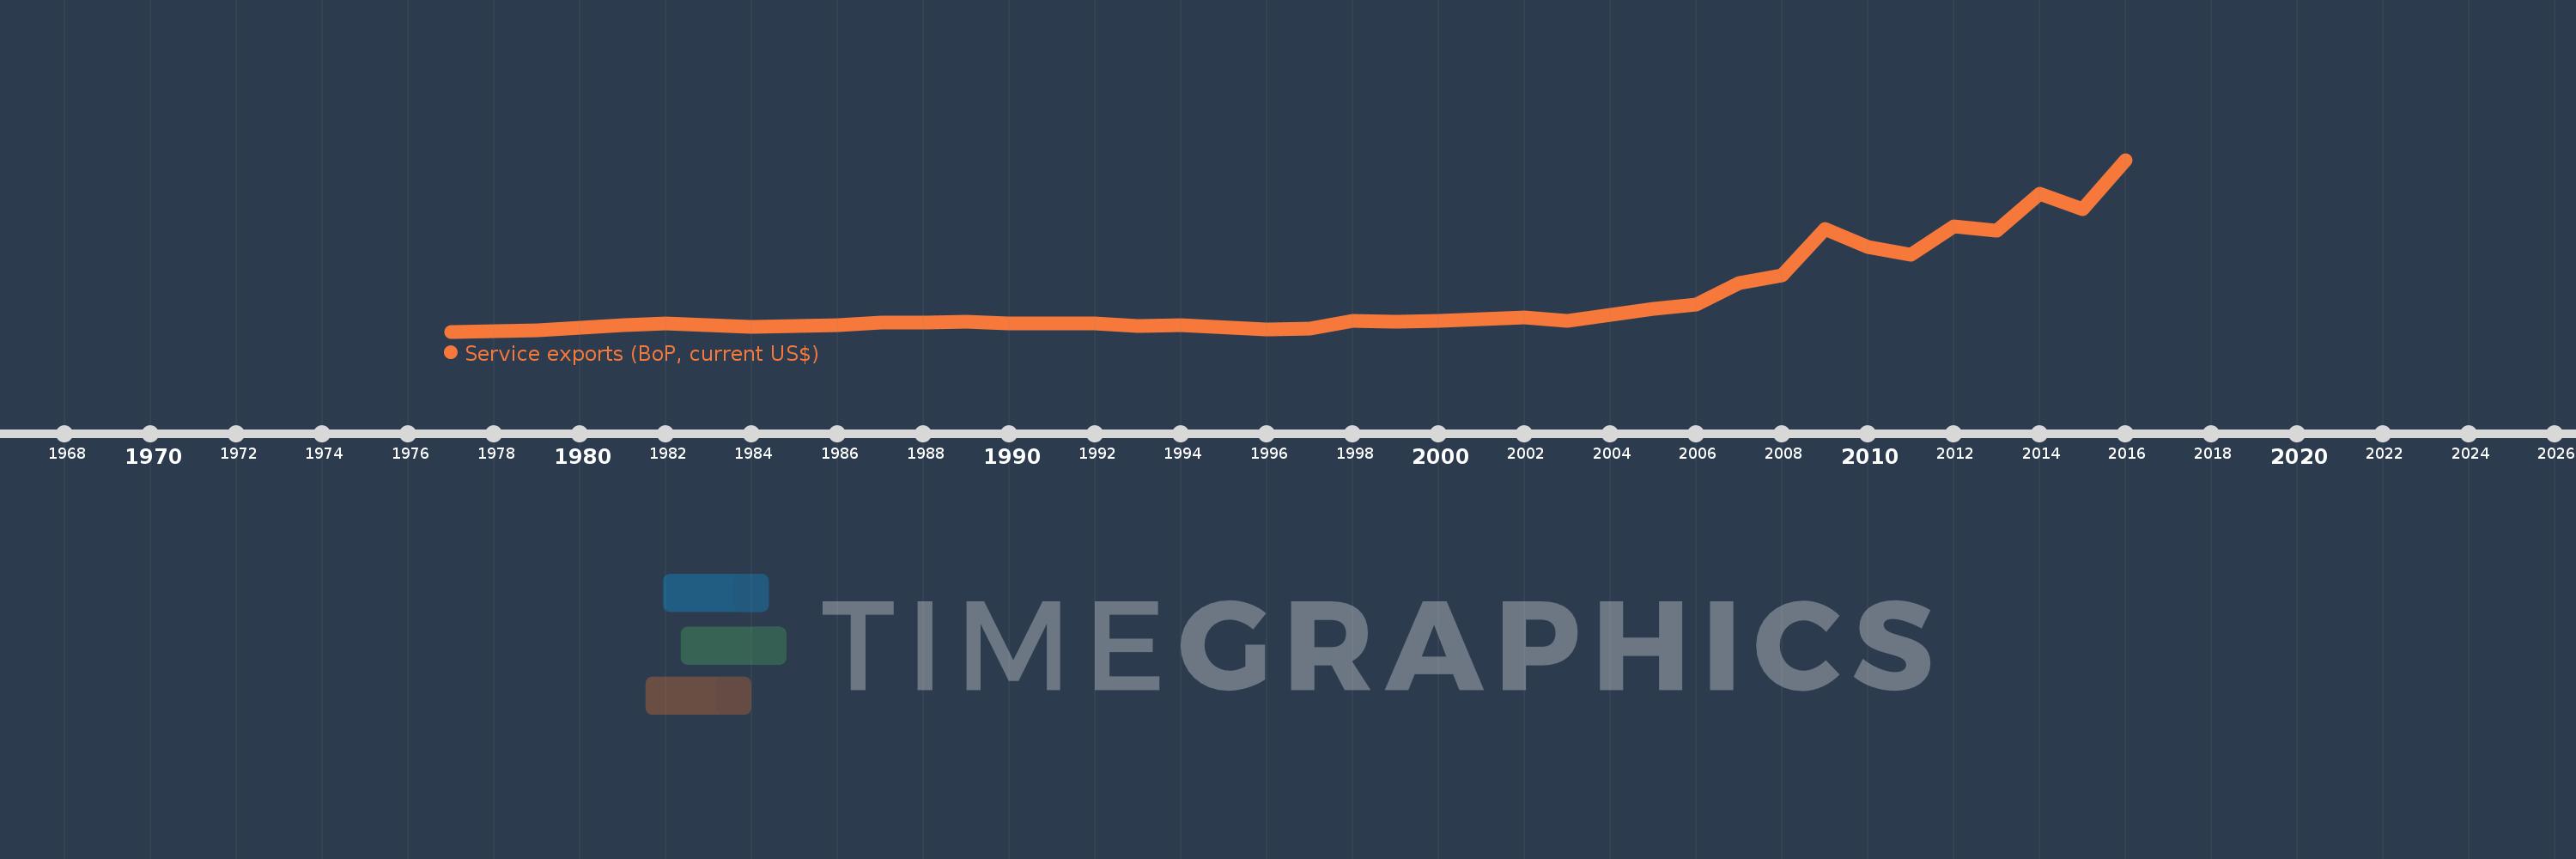
Service exports (BoP, current US$)
2016,2015,2014,2013,2012,2011,2010,2009,2008,2007,2006,2005,2004,2003,2002,2001,2000,1999,1998,1997,1996,1994,1993,1992,1991,1990,1989,1988,1987,1986,1985,1984,1983,1982,1981,1980,1979,1978,1977
This statistics in other country:
AfghanistanAlbaniaAlgeriaAngolaAntigua and BarbudaArab WorldArgentinaArmeniaArubaAustraliaAustriaAzerbaijanBahamas, TheBahrainBangladeshBarbadosBelarusBelgiumBelizeBeninBermudaBhutanBoliviaBosnia and HerzegovinaBotswanaBrazilBrunei DarussalamBulgariaBurkina FasoBurundiCabo VerdeCambodiaCameroonCanadaCaribbean small statesCentral African RepublicCentral Europe and the BalticsChadChileChinaColombiaComorosCongo, Dem. Rep.Congo, Rep.Costa RicaCote d'IvoireCroatiaCuracaoCyprusCzech RepublicDenmarkDjiboutiDominicaDominican RepublicEarly-demographic dividendEast Asia & PacificEast Asia & Pacific (excluding high income)East Asia & Pacific (IDA & IBRD countries)EcuadorEgypt, Arab Rep.El SalvadorEquatorial GuineaEritreaEstoniaEthiopiaEuro areaEurope & Central AsiaEurope & Central Asia (excluding high income)Europe & Central Asia (IDA & IBRD countries)European UnionFaroe IslandsFijiFinlandFragile and conflict affected situationsFranceFrench PolynesiaGabonGambia, TheGeorgiaGermanyGhanaGreeceGrenadaGuatemalaGuineaGuinea-BissauGuyanaHaitiHeavily indebted poor countries (HIPC)High incomeHondurasHong Kong SAR, ChinaHungaryIBRD onlyIcelandIDA & IBRD totalIDA blendIDA onlyIDA totalIndiaIndonesiaIran, Islamic Rep.IraqIrelandIsraelItalyJamaicaJapanJordanKazakhstanKenyaKiribatiKorea, Rep.KosovoKuwaitKyrgyz RepublicLao PDRLate-demographic dividendLatin America & Caribbean Latin America & Caribbean (excluding high income)Latin America & the Caribbean (IDA & IBRD countries)LatviaLeast developed countries: UN classificationLebanonLesothoLiberiaLibyaLithuaniaLow & middle incomeLow incomeLower middle incomeLuxembourgMacao SAR, ChinaMacedonia, FYRMadagascarMalawiMalaysiaMaldivesMaliMaltaMarshall IslandsMauritaniaMauritiusMexicoMicronesia, Fed. Sts.Middle East & North Africa (excluding high income)Middle East & North Africa (IDA & IBRD countries)Middle incomeMoldovaMongoliaMontenegroMoroccoMozambiqueMyanmarNamibiaNepalNetherlandsNew CaledoniaNew ZealandNicaraguaNigerNigeriaNorth AmericaNorwayOECD membersOmanPacific island small statesPakistanPalauPanamaPapua New GuineaParaguayPeruPhilippinesPolandPortugalPost-demographic dividendPre-demographic dividendQatarRomaniaRussian FederationRwandaSamoaSao Tome and PrincipeSaudi ArabiaSenegalSerbiaSeychellesSierra LeoneSingaporeSint Maarten (Dutch part)Slovak RepublicSloveniaSolomon IslandsSouth AfricaSouth AsiaSouth Asia (IDA & IBRD)South SudanSpainSri LankaSt. Kitts and NevisSt. LuciaSt. Vincent and the GrenadinesSub-Saharan Africa Sub-Saharan Africa (excluding high income)Sub-Saharan Africa (IDA & IBRD countries)SudanSurinameSwazilandSwedenSwitzerlandSyrian Arab RepublicTajikistanTanzaniaThailandTimor-LesteTogoTongaTrinidad and TobagoTunisiaTurkeyTuvaluUgandaUkraineUnited KingdomUnited StatesUpper middle incomeUruguayVanuatuVenezuela, RBVietnamWest Bank and GazaWorldYemen, Rep.ZambiaZimbabwe Timeline:
This timeline shows a graph from 1977 to 2016 of Rwanda. No data until 1976. Number of actual observations by date: 39.
Source name:
World Development Indicators
Source organization:
International Monetary Fund, Balance of Payments Statistics Yearbook and data files.
Categories, topics:
Economy & Growth, Trade
Last updated:
apr 23, 2017
Indicators value changes by year
Minimum:
7.649 mln
jan 1, 1977
Maximum:
720.3 mln
jan 1, 2016
At the date of observation
Value
Absolute change
Change from previous value
jan 1, 1977
7.649 mln
+7.649 mln
0.0%
jan 1, 1978
10.653 mln
+3.005 mln
39.28%
jan 1, 1979
14.684 mln
+4.031 mln
37.83%
jan 1, 1980
25.378 mln
+10.694 mln
72.83%
jan 1, 1981
34.288 mln
+8.911 mln
35.11%
jan 1, 1982
39.777 mln
+5.489 mln
16.01%
jan 1, 1983
33.172 mln
-6.605 mln
-16.61%
jan 1, 1984
27.379 mln
-5.793 mln
-17.46%
jan 1, 1985
31.906 mln
+4.526 mln
16.53%
jan 1, 1986
34.906 mln
+3.0 mln
9.4%
jan 1, 1987
43.338 mln
+8.432 mln
24.16%
jan 1, 1988
46.287 mln
+2.949 mln
6.81%
jan 1, 1989
48.177 mln
+1.89 mln
4.08%
jan 1, 1990
42.87 mln
-5.307 mln
-11.01%
jan 1, 1991
41.659 mln
-1.212 mln
-2.83%
jan 1, 1992
42.999 mln
+1.341 mln
3.22%
jan 1, 1993
31.261 mln
-11.739 mln
-27.3%
jan 1, 1994
34.332 mln
+3.072 mln
9.83%
jan 1, 1996
17.892 mln
-16.44 mln
-47.89%
jan 1, 1997
21.568 mln
+3.676 mln
20.55%
jan 1, 1998
51.196 mln
+29.628 mln
137.37%
jan 1, 1999
48.241 mln
-2.955 mln
-5.77%
jan 1, 2000
50.703 mln
+2.462 mln
5.1%
jan 1, 2001
59.316 mln
+8.613 mln
16.99%
jan 1, 2002
65.903 mln
+6.587 mln
11.11%
jan 1, 2003
50.94 mln
-14.963 mln
-22.7%
jan 1, 2004
76.46 mln
+25.52 mln
50.1%
jan 1, 2005
102.65 mln
+26.19 mln
34.25%
jan 1, 2006
119.707 mln
+17.057 mln
16.62%
jan 1, 2007
208.012 mln
+88.305 mln
73.77%
jan 1, 2008
242.773 mln
+34.761 mln
16.71%
jan 1, 2009
432.619 mln
+189.846 mln
78.2%
jan 1, 2010
356.956 mln
-75.663 mln
-17.49%
jan 1, 2011
325.164 mln
-31.792 mln
-8.91%
jan 1, 2012
443.695 mln
+118.531 mln
36.45%
jan 1, 2013
425.361 mln
-18.334 mln
-4.13%
jan 1, 2014
581.091 mln
+155.73 mln
36.61%
jan 1, 2015
516.928 mln
-64.162 mln
-11.04%
jan 1, 2016
720.3 mln
+203.372 mln
39.34%
Ranking of countries by current statistics by years


Comments: