29
/
en
AIzaSyAYiBZKx7MnpbEhh9jyipgxe19OcubqV5w
April 1, 2024
96707
Burundi
BDI
true
2
1
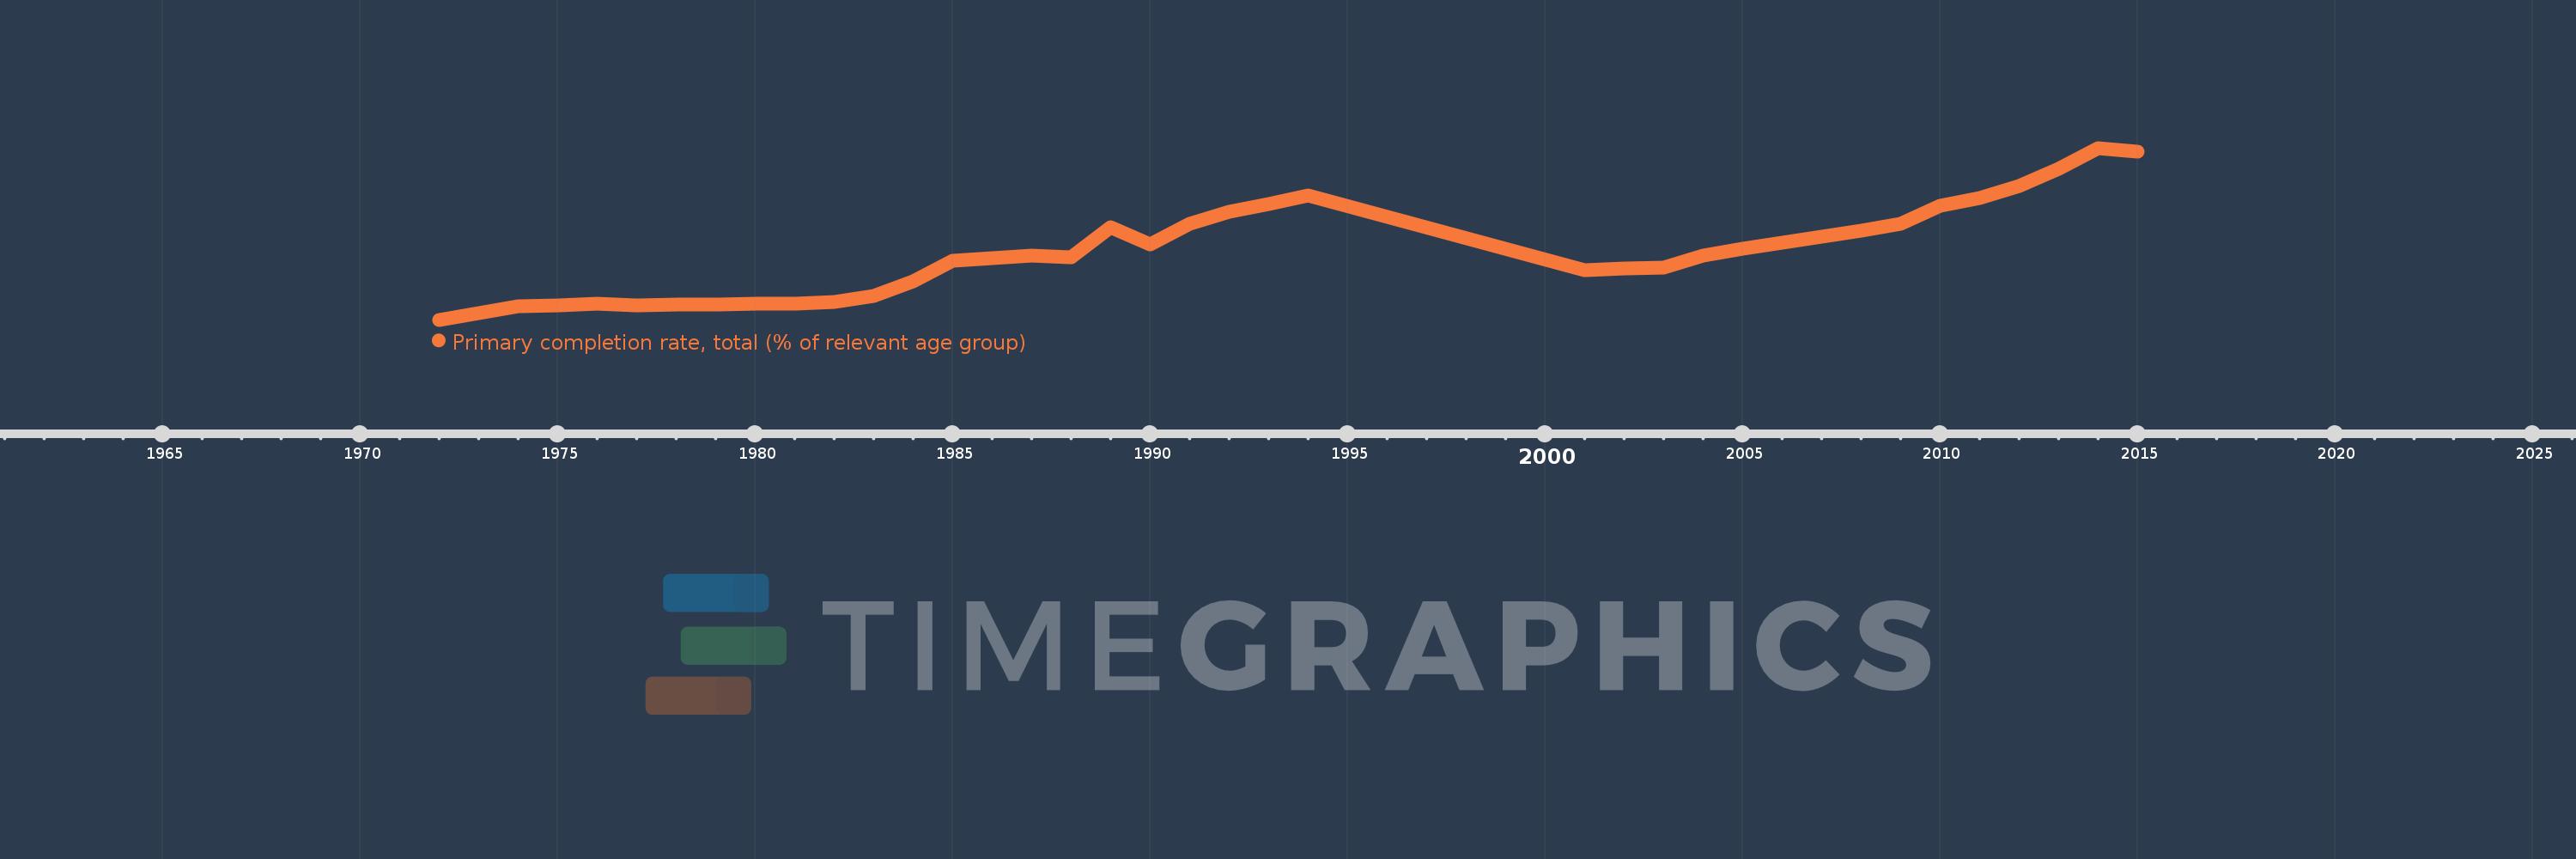
Primary completion rate, total (% of relevant age group)
2015,2014,2013,2012,2011,2010,2009,2008,2006,2005,2004,2003,2002,2001,1994,1993,1992,1991,1990,1989,1988,1987,1986,1985,1984,1983,1982,1981,1980,1979,1978,1977,1976,1975,1974,1972
This statistics in other country:
AfghanistanAlbaniaAlgeriaAngolaAntigua and BarbudaArab WorldArgentinaArmeniaArubaAustriaAzerbaijanBahamas, TheBahrainBangladeshBarbadosBelarusBelgiumBelizeBeninBermudaBhutanBoliviaBosnia and HerzegovinaBotswanaBrazilBritish Virgin IslandsBrunei DarussalamBulgariaBurkina FasoBurundiCabo VerdeCambodiaCameroonCanadaCaribbean small statesCentral African RepublicCentral Europe and the BalticsChadChileChinaColombiaComorosCongo, Dem. Rep.Congo, Rep.Costa RicaCote d'IvoireCroatiaCubaCyprusCzech RepublicDenmarkDjiboutiDominicaDominican RepublicEarly-demographic dividendEast Asia & PacificEast Asia & Pacific (excluding high income)East Asia & Pacific (IDA & IBRD countries)EcuadorEgypt, Arab Rep.El SalvadorEquatorial GuineaEritreaEstoniaEthiopiaEuro areaEurope & Central AsiaEurope & Central Asia (excluding high income)Europe & Central Asia (IDA & IBRD countries)European UnionFijiFinlandFragile and conflict affected situationsFranceGabonGambia, TheGeorgiaGermanyGhanaGreeceGrenadaGuatemalaGuineaGuinea-BissauGuyanaHaitiHeavily indebted poor countries (HIPC)High incomeHondurasHong Kong SAR, ChinaHungaryIBRD onlyIcelandIDA & IBRD totalIDA blendIDA onlyIDA totalIndiaIndonesiaIran, Islamic Rep.IraqIrelandIsraelItalyJamaicaJapanJordanKazakhstanKenyaKiribatiKorea, Dem. People’s Rep.Korea, Rep.KuwaitKyrgyz RepublicLao PDRLate-demographic dividendLatin America & Caribbean Latin America & Caribbean (excluding high income)Latin America & the Caribbean (IDA & IBRD countries)LatviaLeast developed countries: UN classificationLebanonLesothoLiberiaLibyaLiechtensteinLithuaniaLow & middle incomeLow incomeLower middle incomeLuxembourgMacao SAR, ChinaMacedonia, FYRMadagascarMalawiMalaysiaMaldivesMaliMaltaMarshall IslandsMauritaniaMauritiusMexicoMiddle East & North AfricaMiddle East & North Africa (excluding high income)Middle East & North Africa (IDA & IBRD countries)Middle incomeMoldovaMongoliaMontenegroMoroccoMozambiqueMyanmarNamibiaNauruNepalNetherlandsNew ZealandNicaraguaNigerNigeriaNorwayOECD membersOmanOther small statesPacific island small statesPakistanPalauPanamaPapua New GuineaParaguayPeruPhilippinesPolandPortugalPost-demographic dividendPre-demographic dividendQatarRomaniaRussian FederationRwandaSamoaSan MarinoSao Tome and PrincipeSaudi ArabiaSenegalSerbiaSeychellesSierra LeoneSlovak RepublicSloveniaSmall statesSolomon IslandsSouth AfricaSouth AsiaSouth Asia (IDA & IBRD)South SudanSpainSri LankaSt. Kitts and NevisSt. LuciaSt. Vincent and the GrenadinesSub-Saharan Africa Sub-Saharan Africa (excluding high income)Sub-Saharan Africa (IDA & IBRD countries)SudanSurinameSwazilandSwedenSwitzerlandSyrian Arab RepublicTajikistanTanzaniaThailandTimor-LesteTogoTongaTrinidad and TobagoTunisiaTurkeyTuvaluUgandaUkraineUnited Arab EmiratesUpper middle incomeUruguayUzbekistanVanuatuVenezuela, RBVietnamWest Bank and GazaWorldYemen, Rep.ZambiaZimbabwe Timeline:
This timeline shows a graph from 1972 to 2015 of Burundi. No data until 1971. Number of actual observations by date: 36.
Source name:
World Development Indicators
Source organization:
United Nations Educational, Scientific, and Cultural Organization (UNESCO) Institute for Statistics.
Categories, topics:
Aid Effectiveness, Climate Change, Education
Last updated:
apr 23, 2017
Indicators value changes by year
Maximum:
67.828
jan 1, 2014
At the date of observation
Value
Absolute change
Change from previous value
jan 1, 1972
5.82
+5.82
0.0%
jan 1, 1974
10.839
+5.018
86.22%
jan 1, 1975
10.977
+0.138
1.28%
jan 1, 1976
11.669
+0.691
6.3%
jan 1, 1977
10.927
-0.741
-6.35%
jan 1, 1978
11.219
+0.291
2.67%
jan 1, 1979
11.312
+0.093
0.83%
jan 1, 1980
11.504
+0.192
1.7%
jan 1, 1981
11.756
+0.252
2.19%
jan 1, 1982
12.095
+0.339
2.88%
jan 1, 1983
14.474
+2.379
19.67%
jan 1, 1984
19.724
+5.25
36.27%
jan 1, 1985
27.015
+7.291
36.96%
jan 1, 1986
28.148
+1.133
4.19%
jan 1, 1987
29.092
+0.944
3.35%
jan 1, 1988
28.514
-0.578
-1.99%
jan 1, 1989
39.084
+10.57
37.07%
jan 1, 1990
32.988
-6.096
-15.6%
jan 1, 1991
40.568
+7.581
22.98%
jan 1, 1992
44.807
+4.239
10.45%
jan 1, 1993
47.714
+2.906
6.49%
jan 1, 1994
50.779
+3.065
6.42%
jan 1, 2001
23.798
-26.981
-53.13%
jan 1, 2002
24.254
+0.456
1.92%
jan 1, 2003
24.732
+0.478
1.97%
jan 1, 2004
29.119
+4.387
17.74%
jan 1, 2005
31.343
+2.224
7.64%
jan 1, 2006
33.534
+2.191
6.99%
jan 1, 2008
37.954
+4.42
13.18%
jan 1, 2009
40.599
+2.645
6.97%
jan 1, 2010
46.863
+6.263
15.43%
jan 1, 2011
49.634
+2.771
5.91%
jan 1, 2012
54.051
+4.417
8.9%
jan 1, 2013
60.368
+6.317
11.69%
jan 1, 2014
67.828
+7.46
12.36%
jan 1, 2015
66.639
-1.189
-1.75%
Ranking of countries by current statistics by years


Comments: