29
/
en
AIzaSyAYiBZKx7MnpbEhh9jyipgxe19OcubqV5w
April 1, 2024
107897
Colombia
COL
true
2
1
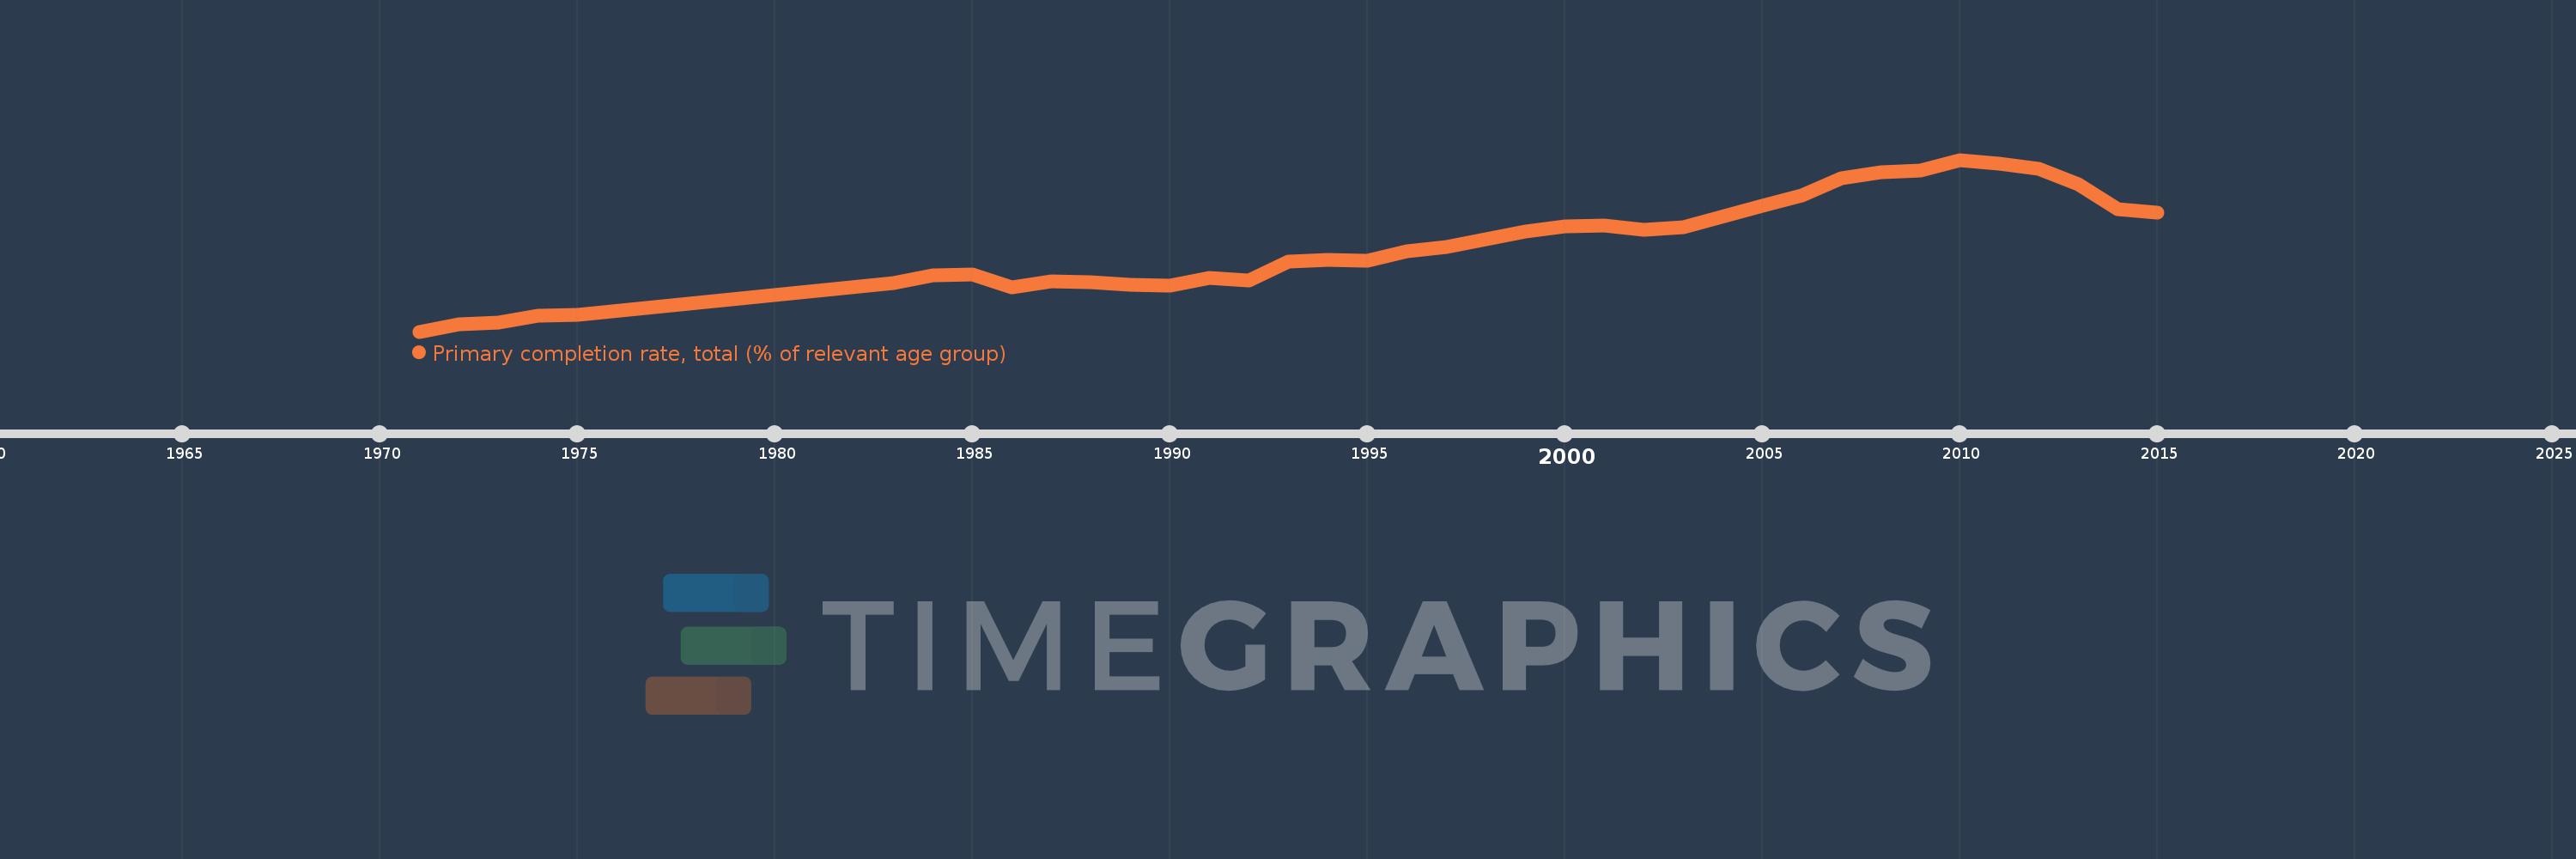
Primary completion rate, total (% of relevant age group)
2015,2014,2013,2012,2011,2010,2009,2008,2007,2006,2005,2003,2002,2001,2000,1999,1997,1996,1995,1994,1993,1992,1991,1990,1989,1988,1987,1986,1985,1984,1983,1975,1974,1973,1972,1971
This statistics in other country:
AfghanistanAlbaniaAlgeriaAngolaAntigua and BarbudaArab WorldArgentinaArmeniaArubaAustriaAzerbaijanBahamas, TheBahrainBangladeshBarbadosBelarusBelgiumBelizeBeninBermudaBhutanBoliviaBosnia and HerzegovinaBotswanaBrazilBritish Virgin IslandsBrunei DarussalamBulgariaBurkina FasoBurundiCabo VerdeCambodiaCameroonCanadaCaribbean small statesCentral African RepublicCentral Europe and the BalticsChadChileChinaColombiaComorosCongo, Dem. Rep.Congo, Rep.Costa RicaCote d'IvoireCroatiaCubaCyprusCzech RepublicDenmarkDjiboutiDominicaDominican RepublicEarly-demographic dividendEast Asia & PacificEast Asia & Pacific (excluding high income)East Asia & Pacific (IDA & IBRD countries)EcuadorEgypt, Arab Rep.El SalvadorEquatorial GuineaEritreaEstoniaEthiopiaEuro areaEurope & Central AsiaEurope & Central Asia (excluding high income)Europe & Central Asia (IDA & IBRD countries)European UnionFijiFinlandFragile and conflict affected situationsFranceGabonGambia, TheGeorgiaGermanyGhanaGreeceGrenadaGuatemalaGuineaGuinea-BissauGuyanaHaitiHeavily indebted poor countries (HIPC)High incomeHondurasHong Kong SAR, ChinaHungaryIBRD onlyIcelandIDA & IBRD totalIDA blendIDA onlyIDA totalIndiaIndonesiaIran, Islamic Rep.IraqIrelandIsraelItalyJamaicaJapanJordanKazakhstanKenyaKiribatiKorea, Dem. People’s Rep.Korea, Rep.KuwaitKyrgyz RepublicLao PDRLate-demographic dividendLatin America & Caribbean Latin America & Caribbean (excluding high income)Latin America & the Caribbean (IDA & IBRD countries)LatviaLeast developed countries: UN classificationLebanonLesothoLiberiaLibyaLiechtensteinLithuaniaLow & middle incomeLow incomeLower middle incomeLuxembourgMacao SAR, ChinaMacedonia, FYRMadagascarMalawiMalaysiaMaldivesMaliMaltaMarshall IslandsMauritaniaMauritiusMexicoMiddle East & North AfricaMiddle East & North Africa (excluding high income)Middle East & North Africa (IDA & IBRD countries)Middle incomeMoldovaMongoliaMontenegroMoroccoMozambiqueMyanmarNamibiaNauruNepalNetherlandsNew ZealandNicaraguaNigerNigeriaNorwayOECD membersOmanOther small statesPacific island small statesPakistanPalauPanamaPapua New GuineaParaguayPeruPhilippinesPolandPortugalPost-demographic dividendPre-demographic dividendQatarRomaniaRussian FederationRwandaSamoaSan MarinoSao Tome and PrincipeSaudi ArabiaSenegalSerbiaSeychellesSierra LeoneSlovak RepublicSloveniaSmall statesSolomon IslandsSouth AfricaSouth AsiaSouth Asia (IDA & IBRD)South SudanSpainSri LankaSt. Kitts and NevisSt. LuciaSt. Vincent and the GrenadinesSub-Saharan Africa Sub-Saharan Africa (excluding high income)Sub-Saharan Africa (IDA & IBRD countries)SudanSurinameSwazilandSwedenSwitzerlandSyrian Arab RepublicTajikistanTanzaniaThailandTimor-LesteTogoTongaTrinidad and TobagoTunisiaTurkeyTuvaluUgandaUkraineUnited Arab EmiratesUpper middle incomeUruguayUzbekistanVanuatuVenezuela, RBVietnamWest Bank and GazaWorldYemen, Rep.ZambiaZimbabwe Timeline:
This timeline shows a graph from 1971 to 2015 of Colombia. No data until 1970. Number of actual observations by date: 36.
Source name:
World Development Indicators
Source organization:
United Nations Educational, Scientific, and Cultural Organization (UNESCO) Institute for Statistics.
Categories, topics:
Aid Effectiveness, Climate Change, Education
Last updated:
apr 23, 2017
Indicators value changes by year
Minimum:
47.636
jan 1, 1971
Maximum:
124.105
jan 1, 2010
At the date of observation
Value
Absolute change
Change from previous value
jan 1, 1971
47.636
+47.636
0.0%
jan 1, 1972
50.909
+3.273
6.87%
jan 1, 1973
51.589
+0.679
1.33%
jan 1, 1974
54.634
+3.045
5.9%
jan 1, 1975
55.138
+0.504
0.92%
jan 1, 1983
69.282
+14.144
25.65%
jan 1, 1984
72.523
+3.241
4.68%
jan 1, 1985
72.989
+0.467
0.64%
jan 1, 1986
67.213
-5.776
-7.91%
jan 1, 1987
69.971
+2.758
4.1%
jan 1, 1988
69.468
-0.503
-0.72%
jan 1, 1989
68.644
-0.824
-1.19%
jan 1, 1990
68.057
-0.587
-0.86%
jan 1, 1991
71.681
+3.624
5.33%
jan 1, 1992
70.576
-1.105
-1.54%
jan 1, 1993
78.648
+8.072
11.44%
jan 1, 1994
79.392
+0.744
0.95%
jan 1, 1995
79.214
-0.178
-0.22%
jan 1, 1996
83.442
+4.229
5.34%
jan 1, 1997
85.193
+1.751
2.1%
jan 1, 1999
92.209
+7.015
8.23%
jan 1, 2000
94.353
+2.144
2.33%
jan 1, 2001
94.986
+0.633
0.67%
jan 1, 2002
92.977
-2.009
-2.11%
jan 1, 2003
94.118
+1.141
1.23%
jan 1, 2005
103.521
+9.402
9.99%
jan 1, 2006
108.417
+4.897
4.73%
jan 1, 2007
115.746
+7.328
6.76%
jan 1, 2008
118.566
+2.82
2.44%
jan 1, 2009
119.184
+0.618
0.52%
jan 1, 2010
124.105
+4.921
4.13%
jan 1, 2011
122.44
-1.665
-1.34%
jan 1, 2012
119.934
-2.506
-2.05%
jan 1, 2013
113.19
-6.744
-5.62%
jan 1, 2014
102.108
-11.083
-9.79%
jan 1, 2015
100.602
-1.506
-1.47%
Ranking of countries by current statistics by years


Comments: