29
/
en
AIzaSyAYiBZKx7MnpbEhh9jyipgxe19OcubqV5w
April 1, 2024
55828
Pre-demographic dividend
PRE
false
2
1
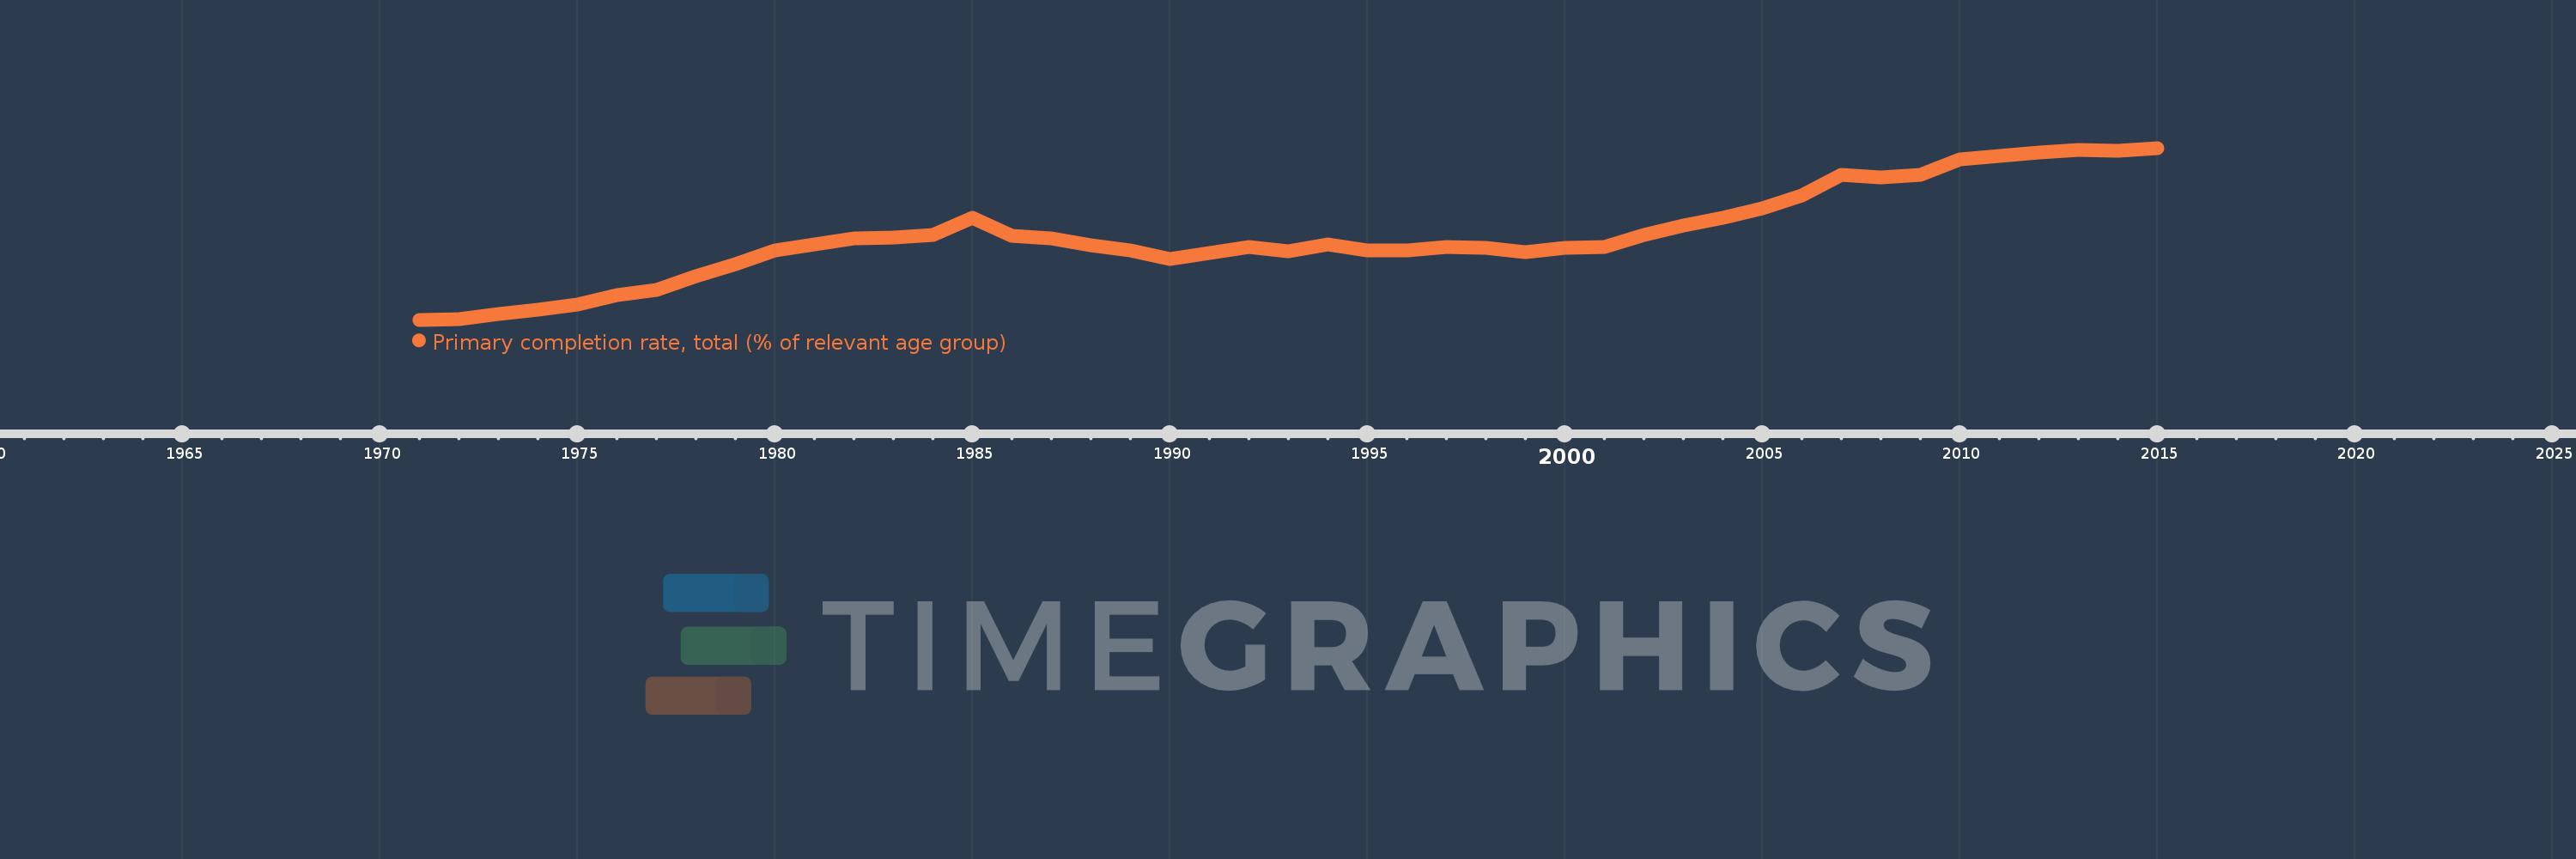
Primary completion rate, total (% of relevant age group)
2015,2014,2013,2012,2011,2010,2009,2008,2007,2006,2005,2004,2003,2002,2001,2000,1999,1998,1997,1996,1995,1994,1993,1992,1991,1990,1989,1988,1987,1986,1985,1984,1983,1982,1981,1980,1979,1978,1977,1976,1975,1974,1973,1972,1971
This statistics in other country:
AfghanistanAlbaniaAlgeriaAngolaAntigua and BarbudaArab WorldArgentinaArmeniaArubaAustriaAzerbaijanBahamas, TheBahrainBangladeshBarbadosBelarusBelgiumBelizeBeninBermudaBhutanBoliviaBosnia and HerzegovinaBotswanaBrazilBritish Virgin IslandsBrunei DarussalamBulgariaBurkina FasoBurundiCabo VerdeCambodiaCameroonCanadaCaribbean small statesCentral African RepublicCentral Europe and the BalticsChadChileChinaColombiaComorosCongo, Dem. Rep.Congo, Rep.Costa RicaCote d'IvoireCroatiaCubaCyprusCzech RepublicDenmarkDjiboutiDominicaDominican RepublicEarly-demographic dividendEast Asia & PacificEast Asia & Pacific (excluding high income)East Asia & Pacific (IDA & IBRD countries)EcuadorEgypt, Arab Rep.El SalvadorEquatorial GuineaEritreaEstoniaEthiopiaEuro areaEurope & Central AsiaEurope & Central Asia (excluding high income)Europe & Central Asia (IDA & IBRD countries)European UnionFijiFinlandFragile and conflict affected situationsFranceGabonGambia, TheGeorgiaGermanyGhanaGreeceGrenadaGuatemalaGuineaGuinea-BissauGuyanaHaitiHeavily indebted poor countries (HIPC)High incomeHondurasHong Kong SAR, ChinaHungaryIBRD onlyIcelandIDA & IBRD totalIDA blendIDA onlyIDA totalIndiaIndonesiaIran, Islamic Rep.IraqIrelandIsraelItalyJamaicaJapanJordanKazakhstanKenyaKiribatiKorea, Dem. People’s Rep.Korea, Rep.KuwaitKyrgyz RepublicLao PDRLate-demographic dividendLatin America & Caribbean Latin America & Caribbean (excluding high income)Latin America & the Caribbean (IDA & IBRD countries)LatviaLeast developed countries: UN classificationLebanonLesothoLiberiaLibyaLiechtensteinLithuaniaLow & middle incomeLow incomeLower middle incomeLuxembourgMacao SAR, ChinaMacedonia, FYRMadagascarMalawiMalaysiaMaldivesMaliMaltaMarshall IslandsMauritaniaMauritiusMexicoMiddle East & North AfricaMiddle East & North Africa (excluding high income)Middle East & North Africa (IDA & IBRD countries)Middle incomeMoldovaMongoliaMontenegroMoroccoMozambiqueMyanmarNamibiaNauruNepalNetherlandsNew ZealandNicaraguaNigerNigeriaNorwayOECD membersOmanOther small statesPacific island small statesPakistanPalauPanamaPapua New GuineaParaguayPeruPhilippinesPolandPortugalPost-demographic dividendPre-demographic dividendQatarRomaniaRussian FederationRwandaSamoaSan MarinoSao Tome and PrincipeSaudi ArabiaSenegalSerbiaSeychellesSierra LeoneSlovak RepublicSloveniaSmall statesSolomon IslandsSouth AfricaSouth AsiaSouth Asia (IDA & IBRD)South SudanSpainSri LankaSt. Kitts and NevisSt. LuciaSt. Vincent and the GrenadinesSub-Saharan Africa Sub-Saharan Africa (excluding high income)Sub-Saharan Africa (IDA & IBRD countries)SudanSurinameSwazilandSwedenSwitzerlandSyrian Arab RepublicTajikistanTanzaniaThailandTimor-LesteTogoTongaTrinidad and TobagoTunisiaTurkeyTuvaluUgandaUkraineUnited Arab EmiratesUpper middle incomeUruguayUzbekistanVanuatuVenezuela, RBVietnamWest Bank and GazaWorldYemen, Rep.ZambiaZimbabwe Timeline:
This timeline shows a graph from 1971 to 2015 of Pre-demographic dividend. No data until 1970. Number of actual observations by date: 45.
Source name:
World Development Indicators
Source organization:
United Nations Educational, Scientific, and Cultural Organization (UNESCO) Institute for Statistics.
Categories, topics:
Aid Effectiveness, Climate Change, Education
Last updated:
apr 23, 2017
Indicators value changes by year
Minimum:
43.641
jan 1, 1971
Maximum:
68.322
jan 1, 2015
At the date of observation
Value
Absolute change
Change from previous value
jan 1, 1971
43.641
+43.641
0.0%
jan 1, 1972
43.718
+0.077
0.18%
jan 1, 1973
44.417
+0.698
1.6%
jan 1, 1974
45.141
+0.724
1.63%
jan 1, 1975
45.816
+0.675
1.5%
jan 1, 1976
47.136
+1.32
2.88%
jan 1, 1977
47.964
+0.828
1.76%
jan 1, 1978
49.906
+1.941
4.05%
jan 1, 1979
51.591
+1.685
3.38%
jan 1, 1980
53.613
+2.022
3.92%
jan 1, 1981
54.469
+0.856
1.6%
jan 1, 1982
55.381
+0.912
1.68%
jan 1, 1983
55.476
+0.095
0.17%
jan 1, 1984
55.805
+0.328
0.59%
jan 1, 1985
58.329
+2.524
4.52%
jan 1, 1986
55.648
-2.68
-4.6%
jan 1, 1987
55.348
-0.3
-0.54%
jan 1, 1988
54.304
-1.044
-1.89%
jan 1, 1989
53.564
-0.74
-1.36%
jan 1, 1990
52.396
-1.168
-2.18%
jan 1, 1991
53.246
+0.85
1.62%
jan 1, 1992
54.039
+0.792
1.49%
jan 1, 1993
53.429
-0.609
-1.13%
jan 1, 1994
54.412
+0.983
1.84%
jan 1, 1995
53.576
-0.836
-1.54%
jan 1, 1996
53.648
+0.072
0.13%
jan 1, 1997
54.086
+0.437
0.82%
jan 1, 1998
53.971
-0.115
-0.21%
jan 1, 1999
53.328
-0.643
-1.19%
jan 1, 2000
53.919
+0.591
1.11%
jan 1, 2001
54.081
+0.162
0.3%
jan 1, 2002
55.829
+1.748
3.23%
jan 1, 2003
57.213
+1.384
2.48%
jan 1, 2004
58.317
+1.104
1.93%
jan 1, 2005
59.671
+1.354
2.32%
jan 1, 2006
61.481
+1.81
3.03%
jan 1, 2007
64.429
+2.948
4.8%
jan 1, 2008
64.045
-0.384
-0.6%
jan 1, 2009
64.496
+0.451
0.7%
jan 1, 2010
66.653
+2.156
3.34%
jan 1, 2011
67.212
+0.559
0.84%
jan 1, 2012
67.672
+0.46
0.68%
jan 1, 2013
68.092
+0.42
0.62%
jan 1, 2014
67.928
-0.163
-0.24%
jan 1, 2015
68.322
+0.394
0.58%
Ranking of countries by current statistics by years


Comments: