29
/
en
AIzaSyAYiBZKx7MnpbEhh9jyipgxe19OcubqV5w
April 1, 2024
42916
Latin America & Caribbean (excluding high income)
LAC
false
2
1
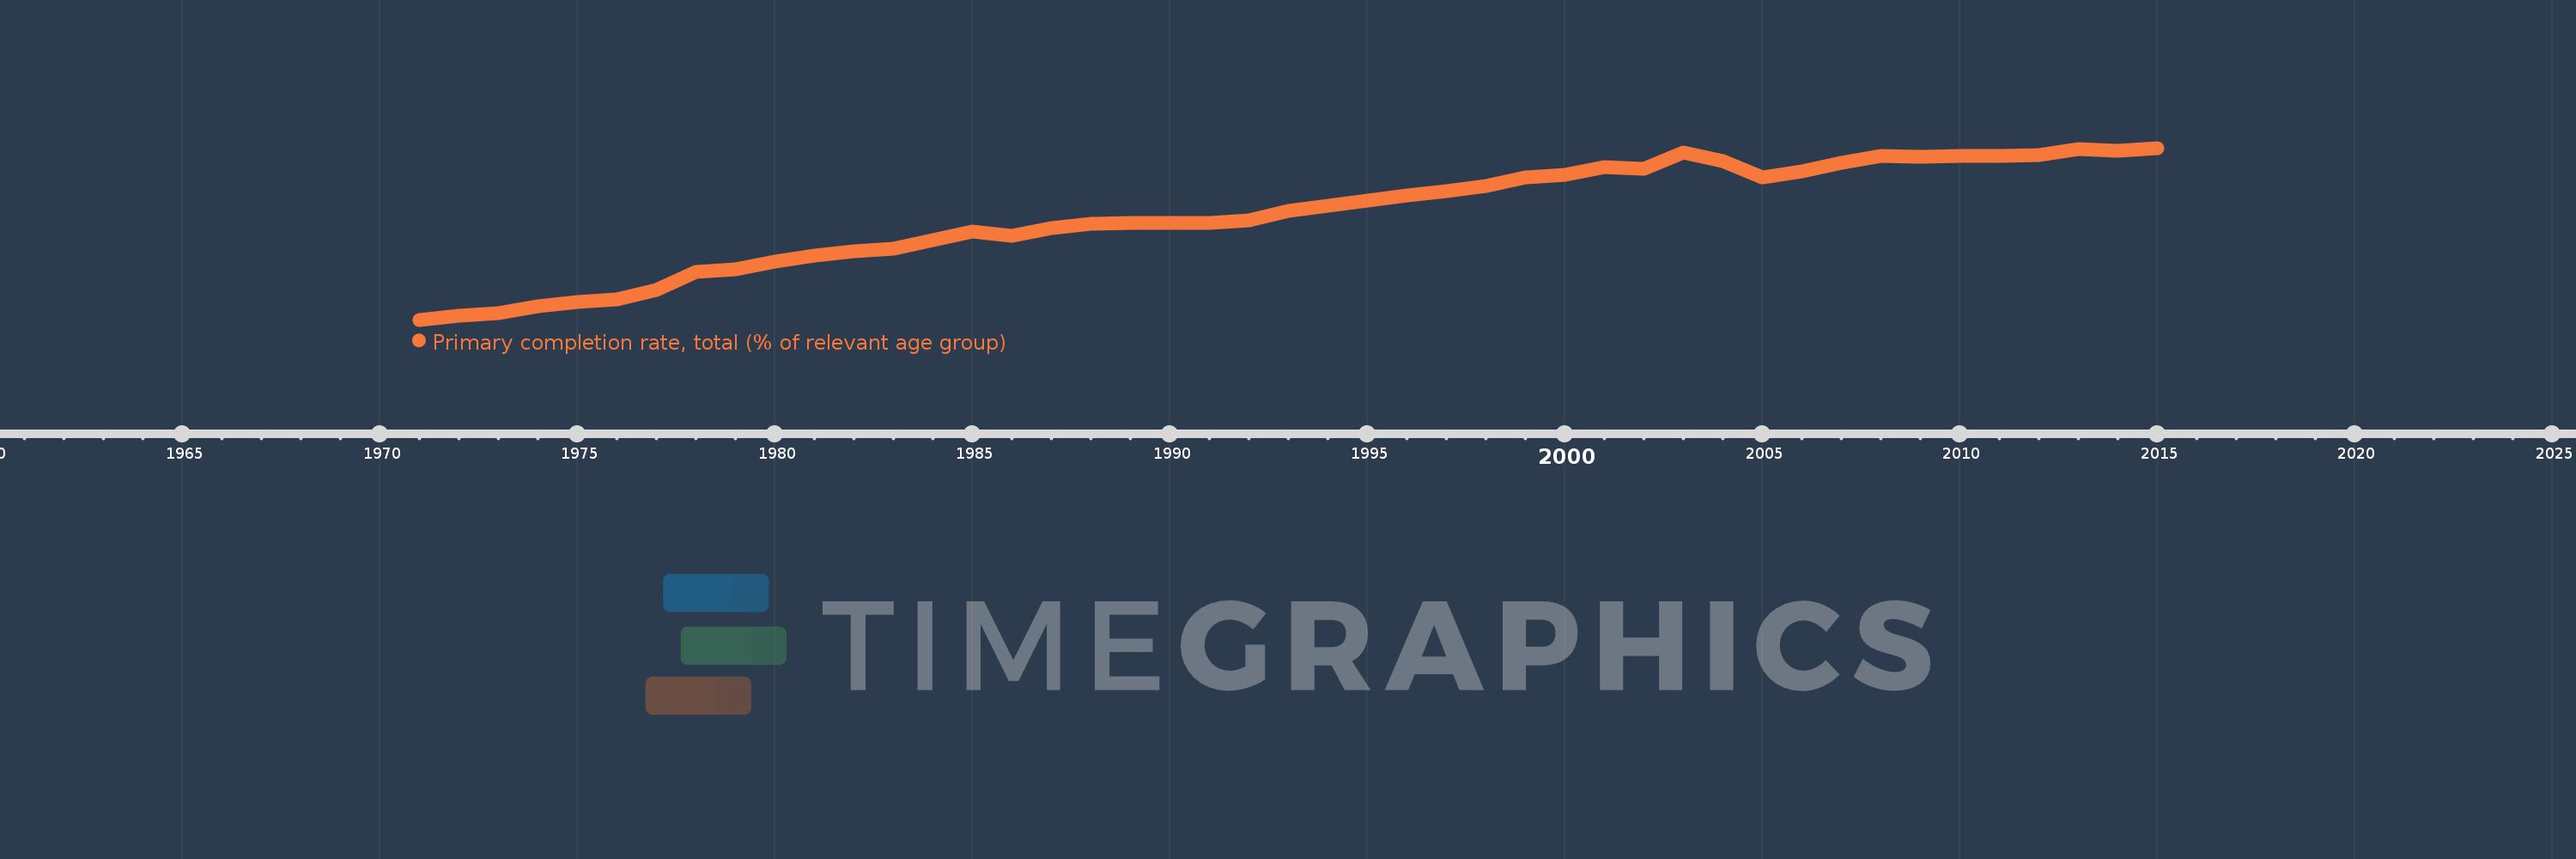
Primary completion rate, total (% of relevant age group)
2015,2014,2013,2012,2011,2010,2009,2008,2007,2006,2005,2004,2003,2002,2001,2000,1999,1998,1997,1996,1995,1994,1993,1992,1991,1990,1989,1988,1987,1986,1985,1984,1983,1982,1981,1980,1979,1978,1977,1976,1975,1974,1973,1972,1971
This statistics in other country:
AfghanistanAlbaniaAlgeriaAngolaAntigua and BarbudaArab WorldArgentinaArmeniaArubaAustriaAzerbaijanBahamas, TheBahrainBangladeshBarbadosBelarusBelgiumBelizeBeninBermudaBhutanBoliviaBosnia and HerzegovinaBotswanaBrazilBritish Virgin IslandsBrunei DarussalamBulgariaBurkina FasoBurundiCabo VerdeCambodiaCameroonCanadaCaribbean small statesCentral African RepublicCentral Europe and the BalticsChadChileChinaColombiaComorosCongo, Dem. Rep.Congo, Rep.Costa RicaCote d'IvoireCroatiaCubaCyprusCzech RepublicDenmarkDjiboutiDominicaDominican RepublicEarly-demographic dividendEast Asia & PacificEast Asia & Pacific (excluding high income)East Asia & Pacific (IDA & IBRD countries)EcuadorEgypt, Arab Rep.El SalvadorEquatorial GuineaEritreaEstoniaEthiopiaEuro areaEurope & Central AsiaEurope & Central Asia (excluding high income)Europe & Central Asia (IDA & IBRD countries)European UnionFijiFinlandFragile and conflict affected situationsFranceGabonGambia, TheGeorgiaGermanyGhanaGreeceGrenadaGuatemalaGuineaGuinea-BissauGuyanaHaitiHeavily indebted poor countries (HIPC)High incomeHondurasHong Kong SAR, ChinaHungaryIBRD onlyIcelandIDA & IBRD totalIDA blendIDA onlyIDA totalIndiaIndonesiaIran, Islamic Rep.IraqIrelandIsraelItalyJamaicaJapanJordanKazakhstanKenyaKiribatiKorea, Dem. People’s Rep.Korea, Rep.KuwaitKyrgyz RepublicLao PDRLate-demographic dividendLatin America & Caribbean Latin America & Caribbean (excluding high income)Latin America & the Caribbean (IDA & IBRD countries)LatviaLeast developed countries: UN classificationLebanonLesothoLiberiaLibyaLiechtensteinLithuaniaLow & middle incomeLow incomeLower middle incomeLuxembourgMacao SAR, ChinaMacedonia, FYRMadagascarMalawiMalaysiaMaldivesMaliMaltaMarshall IslandsMauritaniaMauritiusMexicoMiddle East & North AfricaMiddle East & North Africa (excluding high income)Middle East & North Africa (IDA & IBRD countries)Middle incomeMoldovaMongoliaMontenegroMoroccoMozambiqueMyanmarNamibiaNauruNepalNetherlandsNew ZealandNicaraguaNigerNigeriaNorwayOECD membersOmanOther small statesPacific island small statesPakistanPalauPanamaPapua New GuineaParaguayPeruPhilippinesPolandPortugalPost-demographic dividendPre-demographic dividendQatarRomaniaRussian FederationRwandaSamoaSan MarinoSao Tome and PrincipeSaudi ArabiaSenegalSerbiaSeychellesSierra LeoneSlovak RepublicSloveniaSmall statesSolomon IslandsSouth AfricaSouth AsiaSouth Asia (IDA & IBRD)South SudanSpainSri LankaSt. Kitts and NevisSt. LuciaSt. Vincent and the GrenadinesSub-Saharan Africa Sub-Saharan Africa (excluding high income)Sub-Saharan Africa (IDA & IBRD countries)SudanSurinameSwazilandSwedenSwitzerlandSyrian Arab RepublicTajikistanTanzaniaThailandTimor-LesteTogoTongaTrinidad and TobagoTunisiaTurkeyTuvaluUgandaUkraineUnited Arab EmiratesUpper middle incomeUruguayUzbekistanVanuatuVenezuela, RBVietnamWest Bank and GazaWorldYemen, Rep.ZambiaZimbabwe Timeline:
This timeline shows a graph from 1971 to 2015 of Latin America & Caribbean (excluding high income). No data until 1970. Number of actual observations by date: 45.
Source name:
World Development Indicators
Source organization:
United Nations Educational, Scientific, and Cultural Organization (UNESCO) Institute for Statistics.
Categories, topics:
Aid Effectiveness, Climate Change, Education
Last updated:
apr 23, 2017
Indicators value changes by year
Minimum:
79.074
jan 1, 1971
Maximum:
100.094
jan 1, 2015
At the date of observation
Value
Absolute change
Change from previous value
jan 1, 1971
79.074
+79.074
0.0%
jan 1, 1972
79.575
+0.502
0.63%
jan 1, 1973
79.834
+0.259
0.33%
jan 1, 1974
80.708
+0.874
1.09%
jan 1, 1975
81.206
+0.499
0.62%
jan 1, 1976
81.612
+0.406
0.5%
jan 1, 1977
82.717
+1.105
1.35%
jan 1, 1978
84.942
+2.225
2.69%
jan 1, 1979
85.244
+0.302
0.36%
jan 1, 1980
86.154
+0.91
1.07%
jan 1, 1981
86.913
+0.759
0.88%
jan 1, 1982
87.412
+0.499
0.57%
jan 1, 1983
87.757
+0.345
0.39%
jan 1, 1984
88.792
+1.035
1.18%
jan 1, 1985
89.839
+1.047
1.18%
jan 1, 1986
89.337
-0.502
-0.56%
jan 1, 1987
90.314
+0.977
1.09%
jan 1, 1988
90.842
+0.528
0.58%
jan 1, 1989
90.933
+0.09
0.1%
jan 1, 1990
90.929
-0.003
0.0%
jan 1, 1991
90.953
+0.024
0.03%
jan 1, 1992
91.232
+0.279
0.31%
jan 1, 1993
92.396
+1.163
1.28%
jan 1, 1994
93.052
+0.656
0.71%
jan 1, 1995
93.643
+0.591
0.64%
jan 1, 1996
94.262
+0.619
0.66%
jan 1, 1997
94.822
+0.56
0.59%
jan 1, 1998
95.393
+0.572
0.6%
jan 1, 1999
96.464
+1.07
1.12%
jan 1, 2000
96.841
+0.377
0.39%
jan 1, 2001
97.753
+0.912
0.94%
jan 1, 2002
97.532
-0.222
-0.23%
jan 1, 2003
99.563
+2.031
2.08%
jan 1, 2004
98.484
-1.079
-1.08%
jan 1, 2005
96.496
-1.987
-2.02%
jan 1, 2006
97.27
+0.774
0.8%
jan 1, 2007
98.323
+1.052
1.08%
jan 1, 2008
99.123
+0.801
0.81%
jan 1, 2009
98.965
-0.158
-0.16%
jan 1, 2010
99.066
+0.1
0.1%
jan 1, 2011
99.113
+0.048
0.05%
jan 1, 2012
99.269
+0.156
0.16%
jan 1, 2013
99.949
+0.68
0.69%
jan 1, 2014
99.736
-0.214
-0.21%
jan 1, 2015
100.094
+0.358
0.36%
Ranking of countries by current statistics by years


Comments: