29
/
en
AIzaSyAYiBZKx7MnpbEhh9jyipgxe19OcubqV5w
April 1, 2024
111536
Congo, Rep.
COG
true
2
1
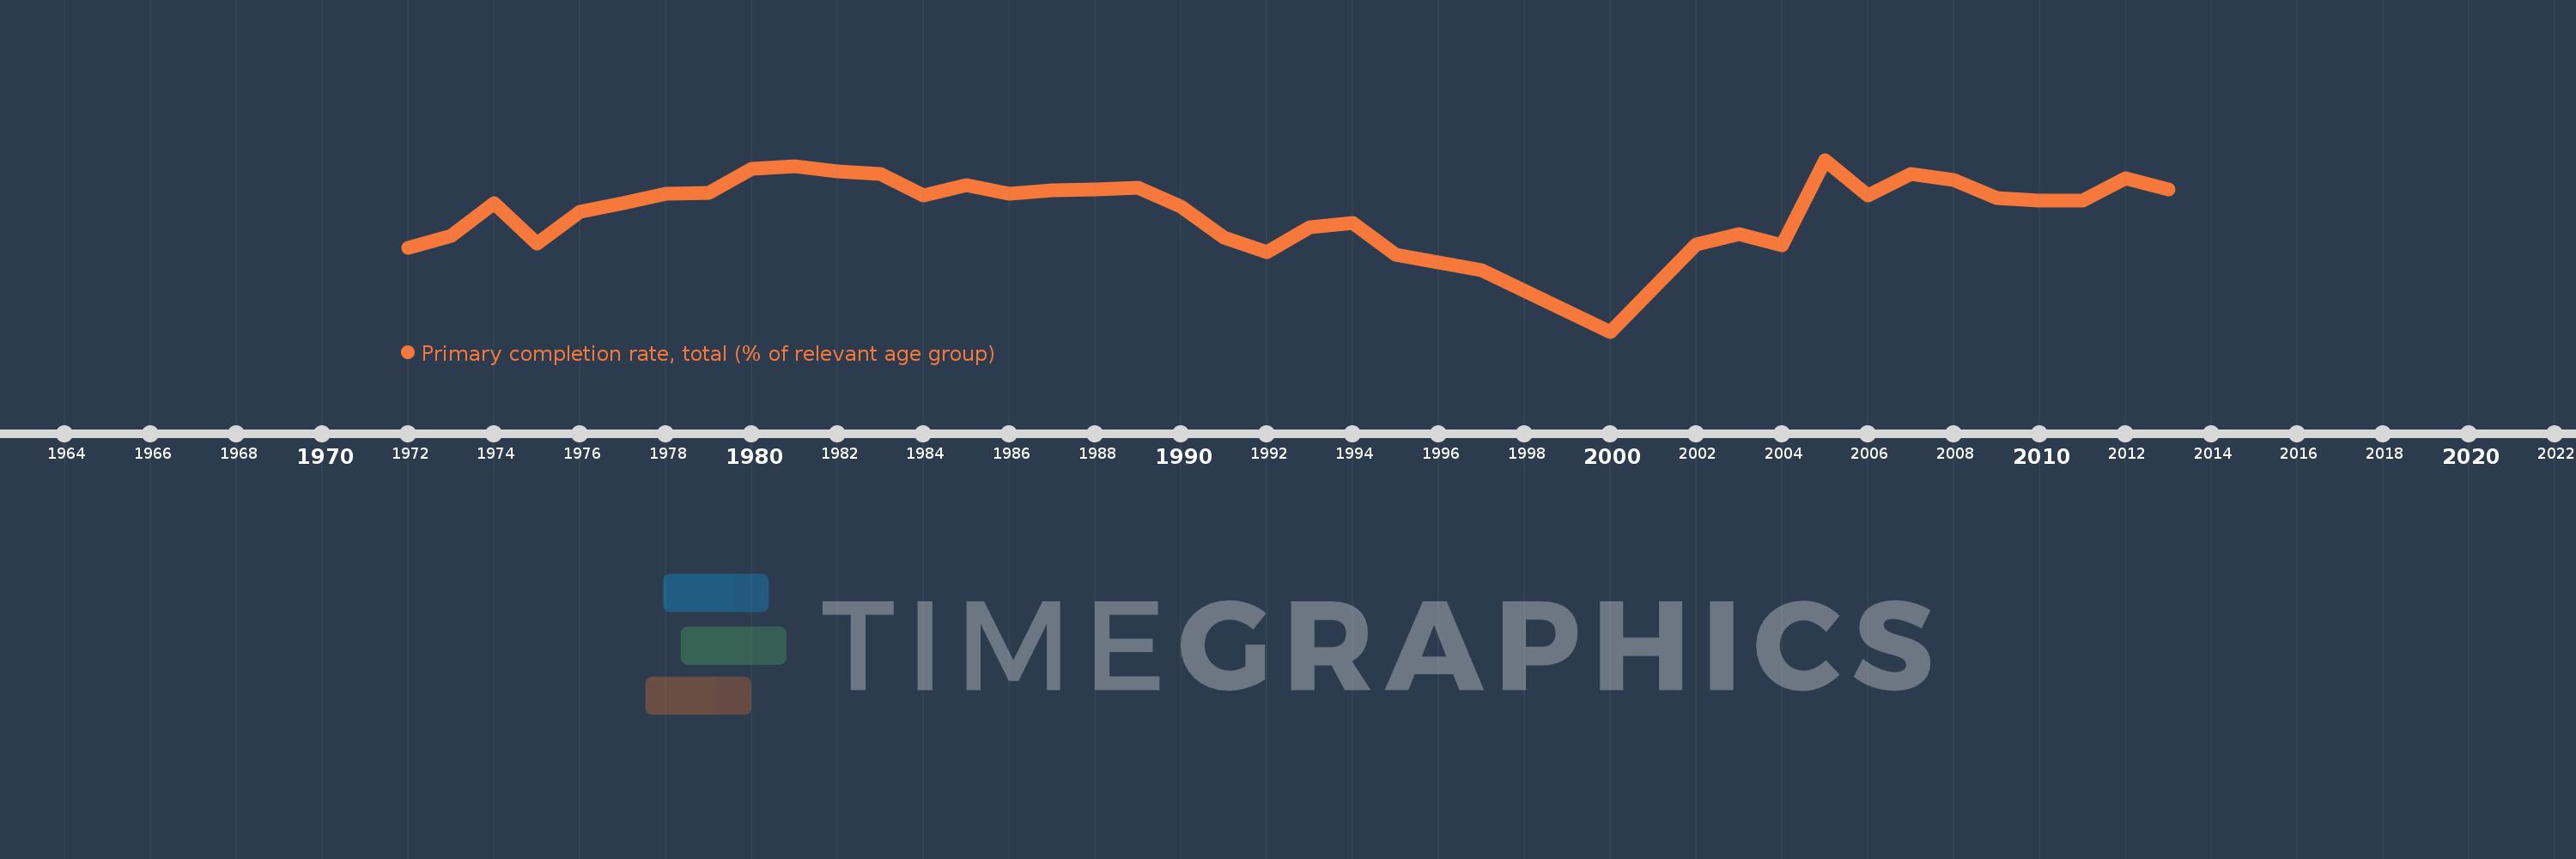
Primary completion rate, total (% of relevant age group)
2013,2012,2011,2010,2009,2008,2007,2006,2005,2004,2003,2002,2000,1997,1995,1994,1993,1992,1991,1990,1989,1988,1987,1986,1985,1984,1983,1982,1981,1980,1979,1978,1977,1976,1975,1974,1973,1972
This statistics in other country:
AfghanistanAlbaniaAlgeriaAngolaAntigua and BarbudaArab WorldArgentinaArmeniaArubaAustriaAzerbaijanBahamas, TheBahrainBangladeshBarbadosBelarusBelgiumBelizeBeninBermudaBhutanBoliviaBosnia and HerzegovinaBotswanaBrazilBritish Virgin IslandsBrunei DarussalamBulgariaBurkina FasoBurundiCabo VerdeCambodiaCameroonCanadaCaribbean small statesCentral African RepublicCentral Europe and the BalticsChadChileChinaColombiaComorosCongo, Dem. Rep.Congo, Rep.Costa RicaCote d'IvoireCroatiaCubaCyprusCzech RepublicDenmarkDjiboutiDominicaDominican RepublicEarly-demographic dividendEast Asia & PacificEast Asia & Pacific (excluding high income)East Asia & Pacific (IDA & IBRD countries)EcuadorEgypt, Arab Rep.El SalvadorEquatorial GuineaEritreaEstoniaEthiopiaEuro areaEurope & Central AsiaEurope & Central Asia (excluding high income)Europe & Central Asia (IDA & IBRD countries)European UnionFijiFinlandFragile and conflict affected situationsFranceGabonGambia, TheGeorgiaGermanyGhanaGreeceGrenadaGuatemalaGuineaGuinea-BissauGuyanaHaitiHeavily indebted poor countries (HIPC)High incomeHondurasHong Kong SAR, ChinaHungaryIBRD onlyIcelandIDA & IBRD totalIDA blendIDA onlyIDA totalIndiaIndonesiaIran, Islamic Rep.IraqIrelandIsraelItalyJamaicaJapanJordanKazakhstanKenyaKiribatiKorea, Dem. People’s Rep.Korea, Rep.KuwaitKyrgyz RepublicLao PDRLate-demographic dividendLatin America & Caribbean Latin America & Caribbean (excluding high income)Latin America & the Caribbean (IDA & IBRD countries)LatviaLeast developed countries: UN classificationLebanonLesothoLiberiaLibyaLiechtensteinLithuaniaLow & middle incomeLow incomeLower middle incomeLuxembourgMacao SAR, ChinaMacedonia, FYRMadagascarMalawiMalaysiaMaldivesMaliMaltaMarshall IslandsMauritaniaMauritiusMexicoMiddle East & North AfricaMiddle East & North Africa (excluding high income)Middle East & North Africa (IDA & IBRD countries)Middle incomeMoldovaMongoliaMontenegroMoroccoMozambiqueMyanmarNamibiaNauruNepalNetherlandsNew ZealandNicaraguaNigerNigeriaNorwayOECD membersOmanOther small statesPacific island small statesPakistanPalauPanamaPapua New GuineaParaguayPeruPhilippinesPolandPortugalPost-demographic dividendPre-demographic dividendQatarRomaniaRussian FederationRwandaSamoaSan MarinoSao Tome and PrincipeSaudi ArabiaSenegalSerbiaSeychellesSierra LeoneSlovak RepublicSloveniaSmall statesSolomon IslandsSouth AfricaSouth AsiaSouth Asia (IDA & IBRD)South SudanSpainSri LankaSt. Kitts and NevisSt. LuciaSt. Vincent and the GrenadinesSub-Saharan Africa Sub-Saharan Africa (excluding high income)Sub-Saharan Africa (IDA & IBRD countries)SudanSurinameSwazilandSwedenSwitzerlandSyrian Arab RepublicTajikistanTanzaniaThailandTimor-LesteTogoTongaTrinidad and TobagoTunisiaTurkeyTuvaluUgandaUkraineUnited Arab EmiratesUpper middle incomeUruguayUzbekistanVanuatuVenezuela, RBVietnamWest Bank and GazaWorldYemen, Rep.ZambiaZimbabwe Timeline:
This timeline shows a graph from 1972 to 2013 of Congo, Rep.. No data until 1971. Number of actual observations by date: 38.
Source name:
World Development Indicators
Source organization:
United Nations Educational, Scientific, and Cultural Organization (UNESCO) Institute for Statistics.
Categories, topics:
Aid Effectiveness, Climate Change, Education
Last updated:
apr 23, 2017
Indicators value changes by year
Minimum:
31.889
jan 1, 2000
Maximum:
82.971
jan 1, 2005
At the date of observation
Value
Absolute change
Change from previous value
jan 1, 1972
56.835
+56.835
0.0%
jan 1, 1973
60.421
+3.586
6.31%
jan 1, 1974
70.047
+9.626
15.93%
jan 1, 1975
57.964
-12.083
-17.25%
jan 1, 1976
67.583
+9.618
16.59%
jan 1, 1977
70.018
+2.436
3.6%
jan 1, 1978
72.853
+2.835
4.05%
jan 1, 1979
73.214
+0.361
0.5%
jan 1, 1980
80.204
+6.99
9.55%
jan 1, 1981
81.143
+0.938
1.17%
jan 1, 1982
79.415
-1.728
-2.13%
jan 1, 1983
78.706
-0.709
-0.89%
jan 1, 1984
72.286
-6.42
-8.16%
jan 1, 1985
75.473
+3.187
4.41%
jan 1, 1986
72.79
-2.684
-3.56%
jan 1, 1987
73.834
+1.044
1.43%
jan 1, 1988
74.28
+0.447
0.6%
jan 1, 1989
74.741
+0.46
0.62%
jan 1, 1990
68.948
-5.793
-7.75%
jan 1, 1991
59.939
-9.009
-13.07%
jan 1, 1992
55.436
-4.503
-7.51%
jan 1, 1993
62.811
+7.375
13.3%
jan 1, 1994
64.295
+1.484
2.36%
jan 1, 1995
54.749
-9.545
-14.85%
jan 1, 1997
50.087
-4.662
-8.51%
jan 1, 2000
31.889
-18.198
-36.33%
jan 1, 2002
57.739
+25.85
81.06%
jan 1, 2003
60.762
+3.023
5.24%
jan 1, 2004
57.495
-3.267
-5.38%
jan 1, 2005
82.971
+25.476
44.31%
jan 1, 2006
72.499
-10.472
-12.62%
jan 1, 2007
78.683
+6.184
8.53%
jan 1, 2008
76.983
-1.7
-2.16%
jan 1, 2009
71.604
-5.379
-6.99%
jan 1, 2010
70.743
-0.861
-1.2%
jan 1, 2011
70.747
+0.004
0.01%
jan 1, 2012
77.549
+6.802
9.61%
jan 1, 2013
74.255
-3.295
-4.25%
Ranking of countries by current statistics by years


Comments: