29
/
en
AIzaSyAYiBZKx7MnpbEhh9jyipgxe19OcubqV5w
April 1, 2024
119311
Denmark
DNK
true
2
1
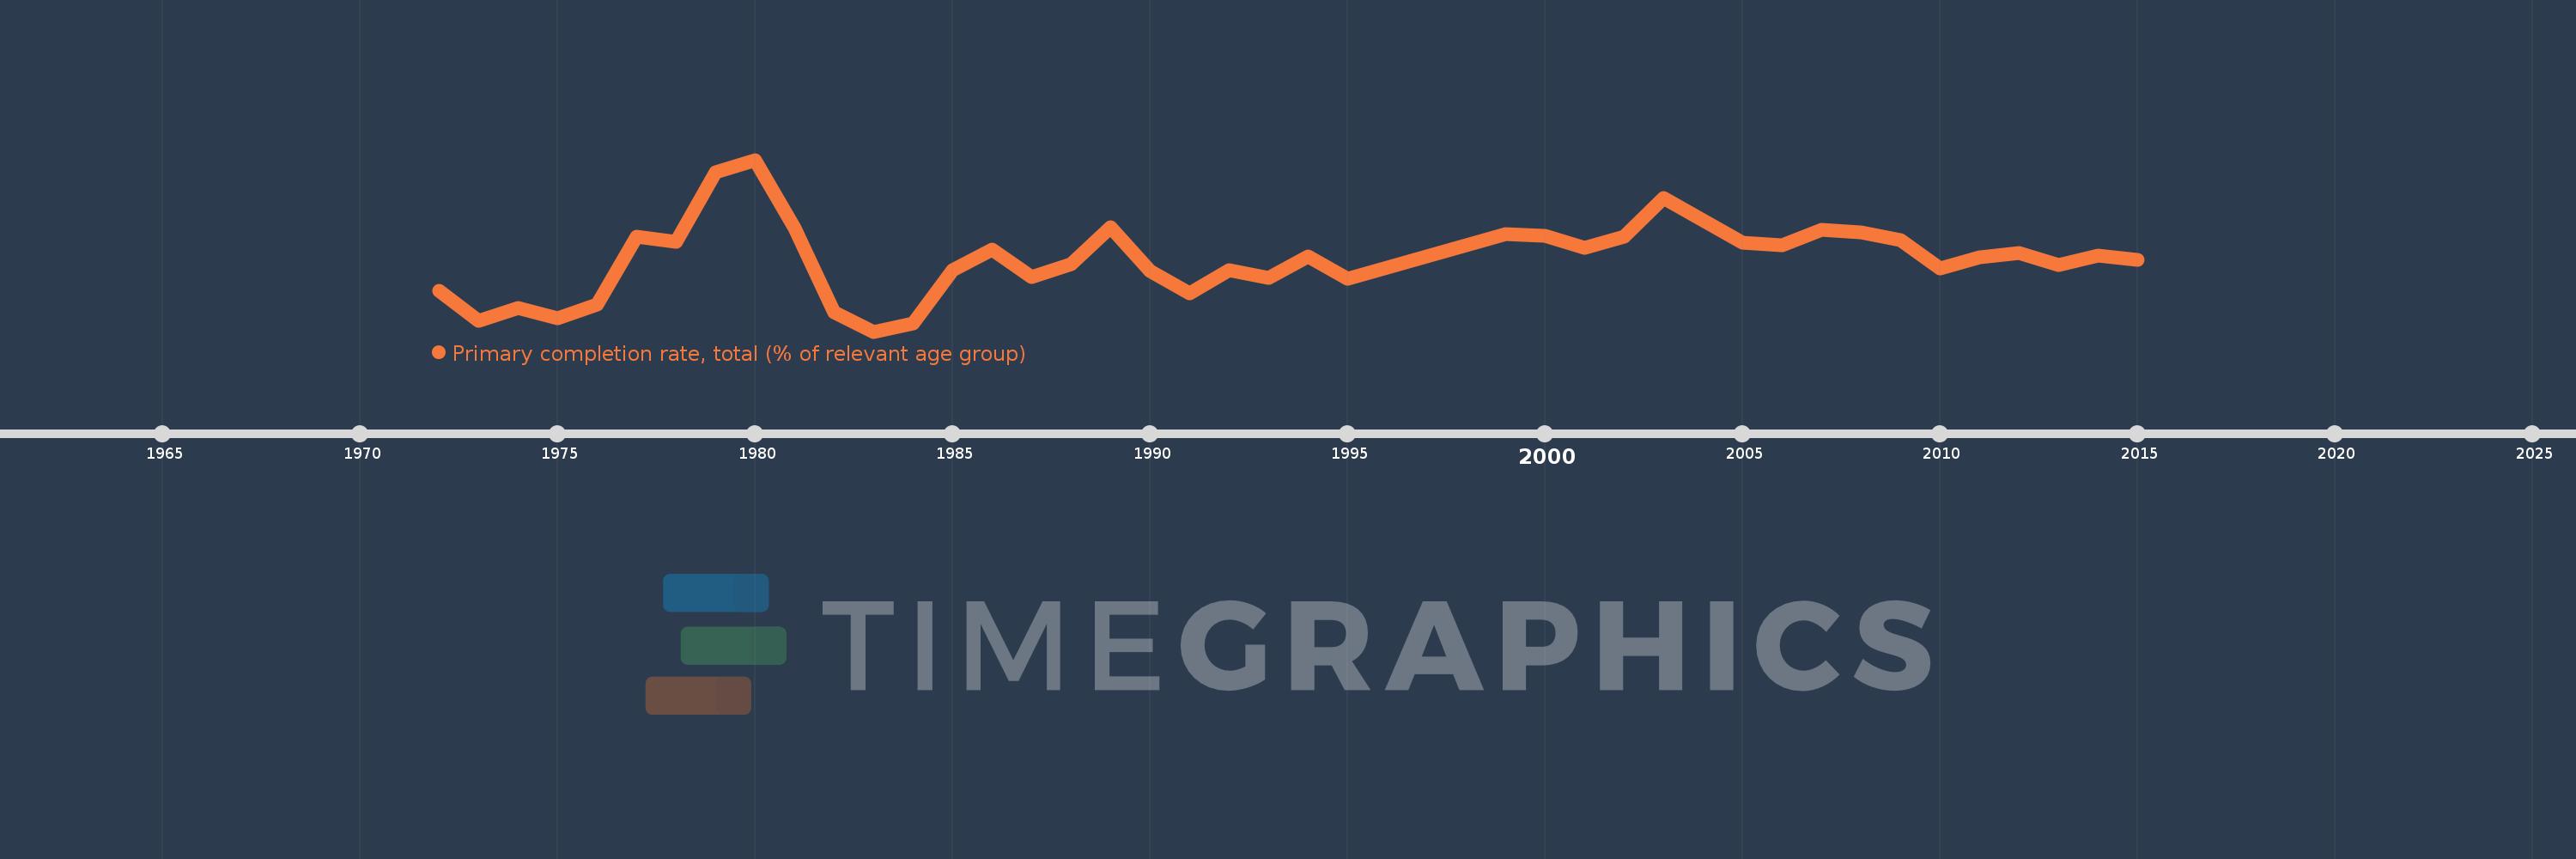
Primary completion rate, total (% of relevant age group)
2015,2014,2013,2012,2011,2010,2009,2008,2007,2006,2005,2003,2002,2001,2000,1999,1995,1994,1993,1992,1991,1990,1989,1988,1987,1986,1985,1984,1983,1982,1981,1980,1979,1978,1977,1976,1975,1974,1973,1972
This statistics in other country:
AfghanistanAlbaniaAlgeriaAngolaAntigua and BarbudaArab WorldArgentinaArmeniaArubaAustriaAzerbaijanBahamas, TheBahrainBangladeshBarbadosBelarusBelgiumBelizeBeninBermudaBhutanBoliviaBosnia and HerzegovinaBotswanaBrazilBritish Virgin IslandsBrunei DarussalamBulgariaBurkina FasoBurundiCabo VerdeCambodiaCameroonCanadaCaribbean small statesCentral African RepublicCentral Europe and the BalticsChadChileChinaColombiaComorosCongo, Dem. Rep.Congo, Rep.Costa RicaCote d'IvoireCroatiaCubaCyprusCzech RepublicDenmarkDjiboutiDominicaDominican RepublicEarly-demographic dividendEast Asia & PacificEast Asia & Pacific (excluding high income)East Asia & Pacific (IDA & IBRD countries)EcuadorEgypt, Arab Rep.El SalvadorEquatorial GuineaEritreaEstoniaEthiopiaEuro areaEurope & Central AsiaEurope & Central Asia (excluding high income)Europe & Central Asia (IDA & IBRD countries)European UnionFijiFinlandFragile and conflict affected situationsFranceGabonGambia, TheGeorgiaGermanyGhanaGreeceGrenadaGuatemalaGuineaGuinea-BissauGuyanaHaitiHeavily indebted poor countries (HIPC)High incomeHondurasHong Kong SAR, ChinaHungaryIBRD onlyIcelandIDA & IBRD totalIDA blendIDA onlyIDA totalIndiaIndonesiaIran, Islamic Rep.IraqIrelandIsraelItalyJamaicaJapanJordanKazakhstanKenyaKiribatiKorea, Dem. People’s Rep.Korea, Rep.KuwaitKyrgyz RepublicLao PDRLate-demographic dividendLatin America & Caribbean Latin America & Caribbean (excluding high income)Latin America & the Caribbean (IDA & IBRD countries)LatviaLeast developed countries: UN classificationLebanonLesothoLiberiaLibyaLiechtensteinLithuaniaLow & middle incomeLow incomeLower middle incomeLuxembourgMacao SAR, ChinaMacedonia, FYRMadagascarMalawiMalaysiaMaldivesMaliMaltaMarshall IslandsMauritaniaMauritiusMexicoMiddle East & North AfricaMiddle East & North Africa (excluding high income)Middle East & North Africa (IDA & IBRD countries)Middle incomeMoldovaMongoliaMontenegroMoroccoMozambiqueMyanmarNamibiaNauruNepalNetherlandsNew ZealandNicaraguaNigerNigeriaNorwayOECD membersOmanOther small statesPacific island small statesPakistanPalauPanamaPapua New GuineaParaguayPeruPhilippinesPolandPortugalPost-demographic dividendPre-demographic dividendQatarRomaniaRussian FederationRwandaSamoaSan MarinoSao Tome and PrincipeSaudi ArabiaSenegalSerbiaSeychellesSierra LeoneSlovak RepublicSloveniaSmall statesSolomon IslandsSouth AfricaSouth AsiaSouth Asia (IDA & IBRD)South SudanSpainSri LankaSt. Kitts and NevisSt. LuciaSt. Vincent and the GrenadinesSub-Saharan Africa Sub-Saharan Africa (excluding high income)Sub-Saharan Africa (IDA & IBRD countries)SudanSurinameSwazilandSwedenSwitzerlandSyrian Arab RepublicTajikistanTanzaniaThailandTimor-LesteTogoTongaTrinidad and TobagoTunisiaTurkeyTuvaluUgandaUkraineUnited Arab EmiratesUpper middle incomeUruguayUzbekistanVanuatuVenezuela, RBVietnamWest Bank and GazaWorldYemen, Rep.ZambiaZimbabwe Timeline:
This timeline shows a graph from 1972 to 2015 of Denmark. No data until 1971. Number of actual observations by date: 40.
Source name:
World Development Indicators
Source organization:
United Nations Educational, Scientific, and Cultural Organization (UNESCO) Institute for Statistics.
Categories, topics:
Aid Effectiveness, Climate Change, Education
Last updated:
apr 23, 2017
Indicators value changes by year
Minimum:
91.355
jan 1, 1983
At the date of observation
Value
Absolute change
Change from previous value
jan 1, 1972
95.631
+95.631
0.0%
jan 1, 1973
92.52
-3.112
-3.25%
jan 1, 1974
93.873
+1.353
1.46%
jan 1, 1975
92.718
-1.155
-1.23%
jan 1, 1976
94.239
+1.521
1.64%
jan 1, 1977
101.336
+7.097
7.53%
jan 1, 1978
100.811
-0.524
-0.52%
jan 1, 1979
108.182
+7.371
7.31%
jan 1, 1980
109.5
+1.318
1.22%
jan 1, 1981
102.313
-7.188
-6.56%
jan 1, 1982
93.359
-8.954
-8.75%
jan 1, 1983
91.355
-2.004
-2.15%
jan 1, 1984
92.248
+0.893
0.98%
jan 1, 1985
97.849
+5.6
6.07%
jan 1, 1986
100.062
+2.213
2.26%
jan 1, 1987
97.12
-2.942
-2.94%
jan 1, 1988
98.491
+1.371
1.41%
jan 1, 1989
102.412
+3.922
3.98%
jan 1, 1990
97.722
-4.69
-4.58%
jan 1, 1991
95.435
-2.287
-2.34%
jan 1, 1992
97.816
+2.381
2.49%
jan 1, 1993
97.068
-0.748
-0.76%
jan 1, 1994
99.332
+2.264
2.33%
jan 1, 1995
96.89
-2.442
-2.46%
jan 1, 1999
101.668
+4.778
4.93%
jan 1, 2000
101.494
-0.174
-0.17%
jan 1, 2001
100.195
-1.3
-1.28%
jan 1, 2002
101.414
+1.219
1.22%
jan 1, 2003
105.471
+4.057
4.0%
jan 1, 2005
100.736
-4.735
-4.49%
jan 1, 2006
100.441
-0.295
-0.29%
jan 1, 2007
102.126
+1.685
1.68%
jan 1, 2008
101.825
-0.301
-0.3%
jan 1, 2009
101.027
-0.798
-0.78%
jan 1, 2010
98.022
-3.004
-2.97%
jan 1, 2011
99.174
+1.152
1.18%
jan 1, 2012
99.698
+0.524
0.53%
jan 1, 2013
98.376
-1.322
-1.33%
jan 1, 2014
99.425
+1.048
1.07%
jan 1, 2015
98.913
-0.511
-0.51%
Ranking of countries by current statistics by years


Comments: