29
/
en
AIzaSyAYiBZKx7MnpbEhh9jyipgxe19OcubqV5w
April 1, 2024
30227
Euro area
EMU
false
2
1
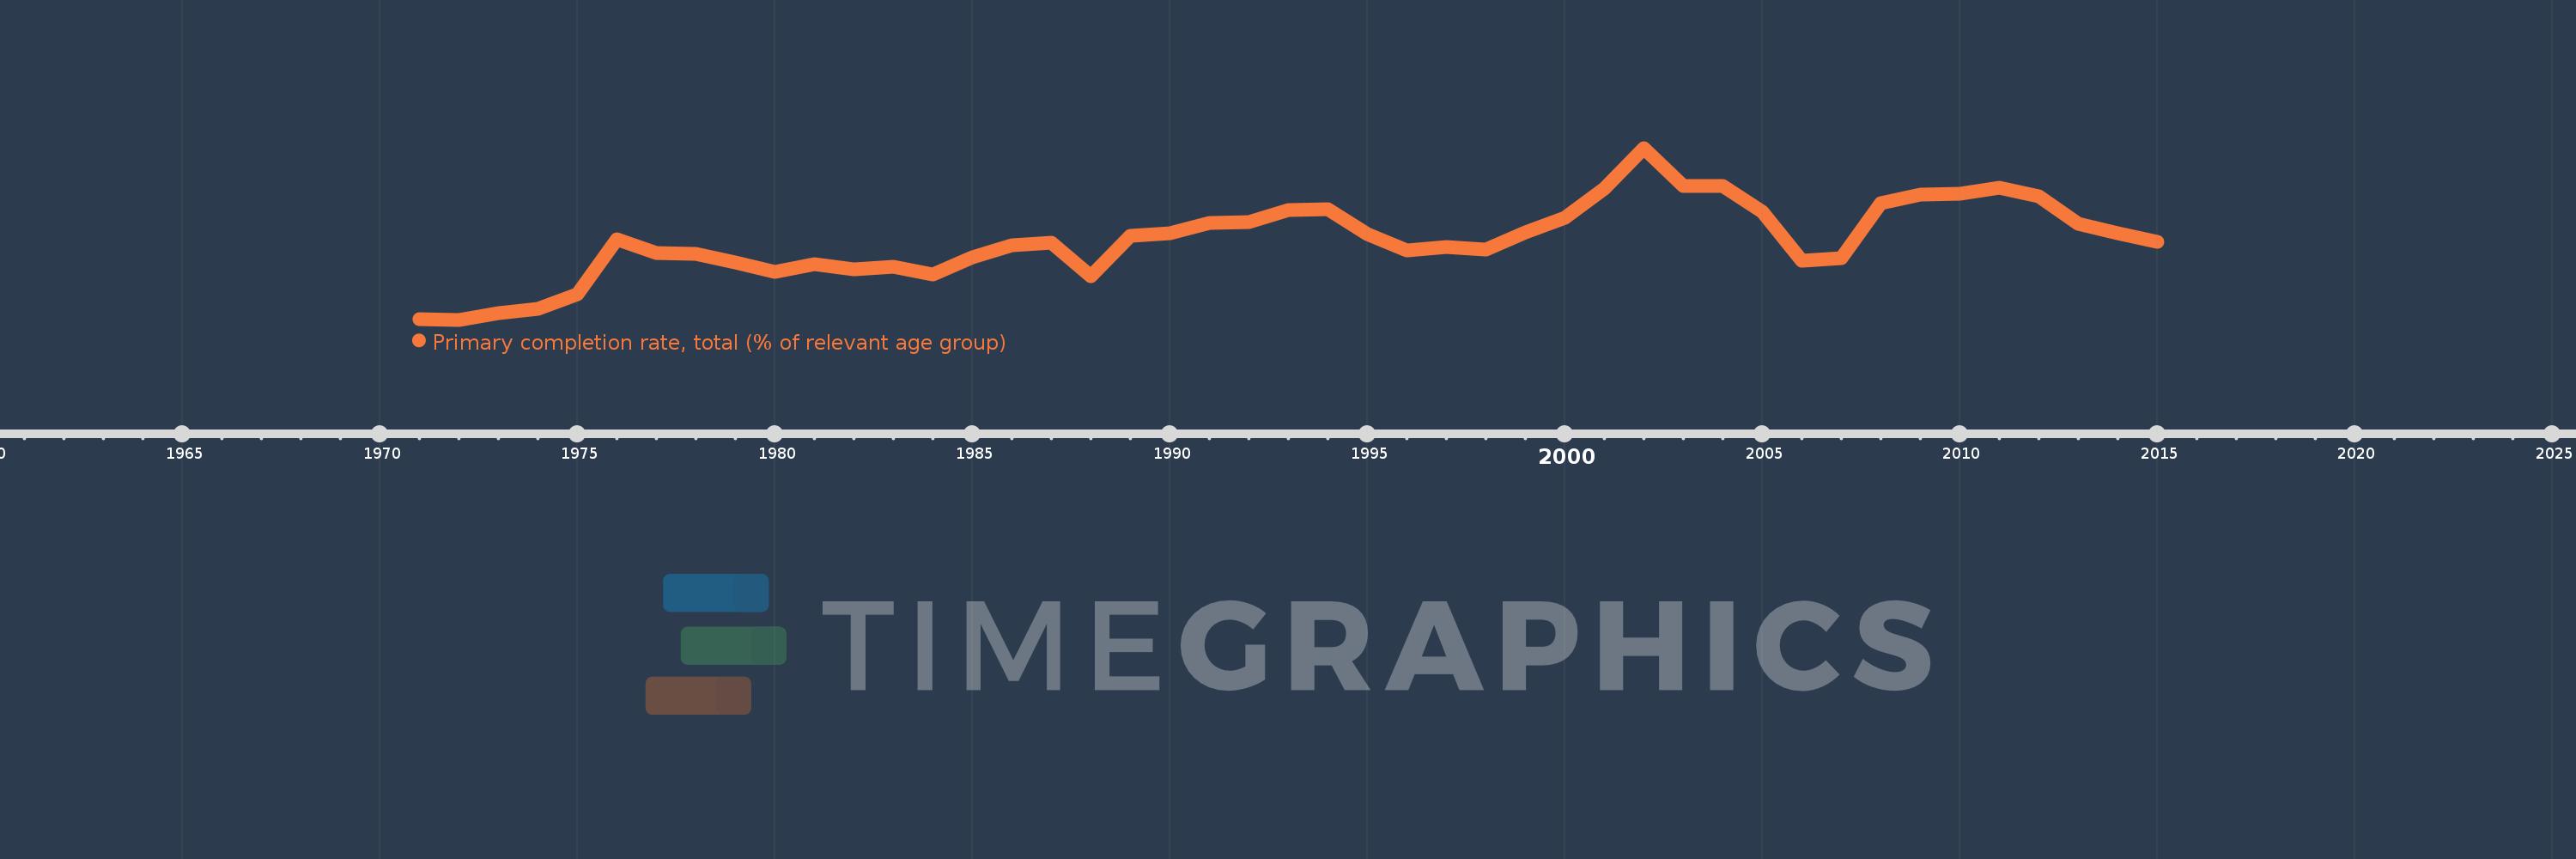
Primary completion rate, total (% of relevant age group)
2015,2014,2013,2012,2011,2010,2009,2008,2007,2006,2005,2004,2003,2002,2001,2000,1999,1998,1997,1996,1995,1994,1993,1992,1991,1990,1989,1988,1987,1986,1985,1984,1983,1982,1981,1980,1979,1978,1977,1976,1975,1974,1973,1972,1971
This statistics in other country:
AfghanistanAlbaniaAlgeriaAngolaAntigua and BarbudaArab WorldArgentinaArmeniaArubaAustriaAzerbaijanBahamas, TheBahrainBangladeshBarbadosBelarusBelgiumBelizeBeninBermudaBhutanBoliviaBosnia and HerzegovinaBotswanaBrazilBritish Virgin IslandsBrunei DarussalamBulgariaBurkina FasoBurundiCabo VerdeCambodiaCameroonCanadaCaribbean small statesCentral African RepublicCentral Europe and the BalticsChadChileChinaColombiaComorosCongo, Dem. Rep.Congo, Rep.Costa RicaCote d'IvoireCroatiaCubaCyprusCzech RepublicDenmarkDjiboutiDominicaDominican RepublicEarly-demographic dividendEast Asia & PacificEast Asia & Pacific (excluding high income)East Asia & Pacific (IDA & IBRD countries)EcuadorEgypt, Arab Rep.El SalvadorEquatorial GuineaEritreaEstoniaEthiopiaEuro areaEurope & Central AsiaEurope & Central Asia (excluding high income)Europe & Central Asia (IDA & IBRD countries)European UnionFijiFinlandFragile and conflict affected situationsFranceGabonGambia, TheGeorgiaGermanyGhanaGreeceGrenadaGuatemalaGuineaGuinea-BissauGuyanaHaitiHeavily indebted poor countries (HIPC)High incomeHondurasHong Kong SAR, ChinaHungaryIBRD onlyIcelandIDA & IBRD totalIDA blendIDA onlyIDA totalIndiaIndonesiaIran, Islamic Rep.IraqIrelandIsraelItalyJamaicaJapanJordanKazakhstanKenyaKiribatiKorea, Dem. People’s Rep.Korea, Rep.KuwaitKyrgyz RepublicLao PDRLate-demographic dividendLatin America & Caribbean Latin America & Caribbean (excluding high income)Latin America & the Caribbean (IDA & IBRD countries)LatviaLeast developed countries: UN classificationLebanonLesothoLiberiaLibyaLiechtensteinLithuaniaLow & middle incomeLow incomeLower middle incomeLuxembourgMacao SAR, ChinaMacedonia, FYRMadagascarMalawiMalaysiaMaldivesMaliMaltaMarshall IslandsMauritaniaMauritiusMexicoMiddle East & North AfricaMiddle East & North Africa (excluding high income)Middle East & North Africa (IDA & IBRD countries)Middle incomeMoldovaMongoliaMontenegroMoroccoMozambiqueMyanmarNamibiaNauruNepalNetherlandsNew ZealandNicaraguaNigerNigeriaNorwayOECD membersOmanOther small statesPacific island small statesPakistanPalauPanamaPapua New GuineaParaguayPeruPhilippinesPolandPortugalPost-demographic dividendPre-demographic dividendQatarRomaniaRussian FederationRwandaSamoaSan MarinoSao Tome and PrincipeSaudi ArabiaSenegalSerbiaSeychellesSierra LeoneSlovak RepublicSloveniaSmall statesSolomon IslandsSouth AfricaSouth AsiaSouth Asia (IDA & IBRD)South SudanSpainSri LankaSt. Kitts and NevisSt. LuciaSt. Vincent and the GrenadinesSub-Saharan Africa Sub-Saharan Africa (excluding high income)Sub-Saharan Africa (IDA & IBRD countries)SudanSurinameSwazilandSwedenSwitzerlandSyrian Arab RepublicTajikistanTanzaniaThailandTimor-LesteTogoTongaTrinidad and TobagoTunisiaTurkeyTuvaluUgandaUkraineUnited Arab EmiratesUpper middle incomeUruguayUzbekistanVanuatuVenezuela, RBVietnamWest Bank and GazaWorldYemen, Rep.ZambiaZimbabwe Timeline:
This timeline shows a graph from 1971 to 2015 of Euro area. No data until 1970. Number of actual observations by date: 45.
Source name:
World Development Indicators
Source organization:
United Nations Educational, Scientific, and Cultural Organization (UNESCO) Institute for Statistics.
Categories, topics:
Aid Effectiveness, Climate Change, Education
Last updated:
apr 23, 2017
Indicators value changes by year
Minimum:
95.083
jan 1, 1972
Maximum:
100.627
jan 1, 2002
At the date of observation
Value
Absolute change
Change from previous value
jan 1, 1971
95.091
+95.091
0.0%
jan 1, 1972
95.083
-0.008
-0.01%
jan 1, 1973
95.295
+0.213
0.22%
jan 1, 1974
95.437
+0.142
0.15%
jan 1, 1975
95.895
+0.459
0.48%
jan 1, 1976
97.669
+1.773
1.85%
jan 1, 1977
97.248
-0.42
-0.43%
jan 1, 1978
97.197
-0.051
-0.05%
jan 1, 1979
96.93
-0.267
-0.27%
jan 1, 1980
96.619
-0.311
-0.32%
jan 1, 1981
96.885
+0.266
0.28%
jan 1, 1982
96.697
-0.188
-0.19%
jan 1, 1983
96.799
+0.102
0.11%
jan 1, 1984
96.53
-0.269
-0.28%
jan 1, 1985
97.107
+0.577
0.6%
jan 1, 1986
97.492
+0.385
0.4%
jan 1, 1987
97.577
+0.084
0.09%
jan 1, 1988
96.48
-1.097
-1.12%
jan 1, 1989
97.789
+1.309
1.36%
jan 1, 1990
97.881
+0.091
0.09%
jan 1, 1991
98.199
+0.319
0.33%
jan 1, 1992
98.221
+0.022
0.02%
jan 1, 1993
98.631
+0.41
0.42%
jan 1, 1994
98.638
+0.007
0.01%
jan 1, 1995
97.847
-0.791
-0.8%
jan 1, 1996
97.316
-0.532
-0.54%
jan 1, 1997
97.444
+0.129
0.13%
jan 1, 1998
97.358
-0.087
-0.09%
jan 1, 1999
97.906
+0.548
0.56%
jan 1, 2000
98.366
+0.46
0.47%
jan 1, 2001
99.313
+0.947
0.96%
jan 1, 2002
100.627
+1.314
1.32%
jan 1, 2003
99.404
-1.223
-1.22%
jan 1, 2004
99.386
-0.018
-0.02%
jan 1, 2005
98.566
-0.82
-0.82%
jan 1, 2006
96.974
-1.592
-1.62%
jan 1, 2007
97.063
+0.088
0.09%
jan 1, 2008
98.832
+1.77
1.82%
jan 1, 2009
99.118
+0.285
0.29%
jan 1, 2010
99.155
+0.038
0.04%
jan 1, 2011
99.335
+0.18
0.18%
jan 1, 2012
99.071
-0.264
-0.27%
jan 1, 2013
98.18
-0.89
-0.9%
jan 1, 2014
97.863
-0.317
-0.32%
jan 1, 2015
97.595
-0.268
-0.27%
Ranking of countries by current statistics by years


Comments: