29
/
en
AIzaSyAYiBZKx7MnpbEhh9jyipgxe19OcubqV5w
April 1, 2024
94158
Bulgaria
BGR
true
2
1
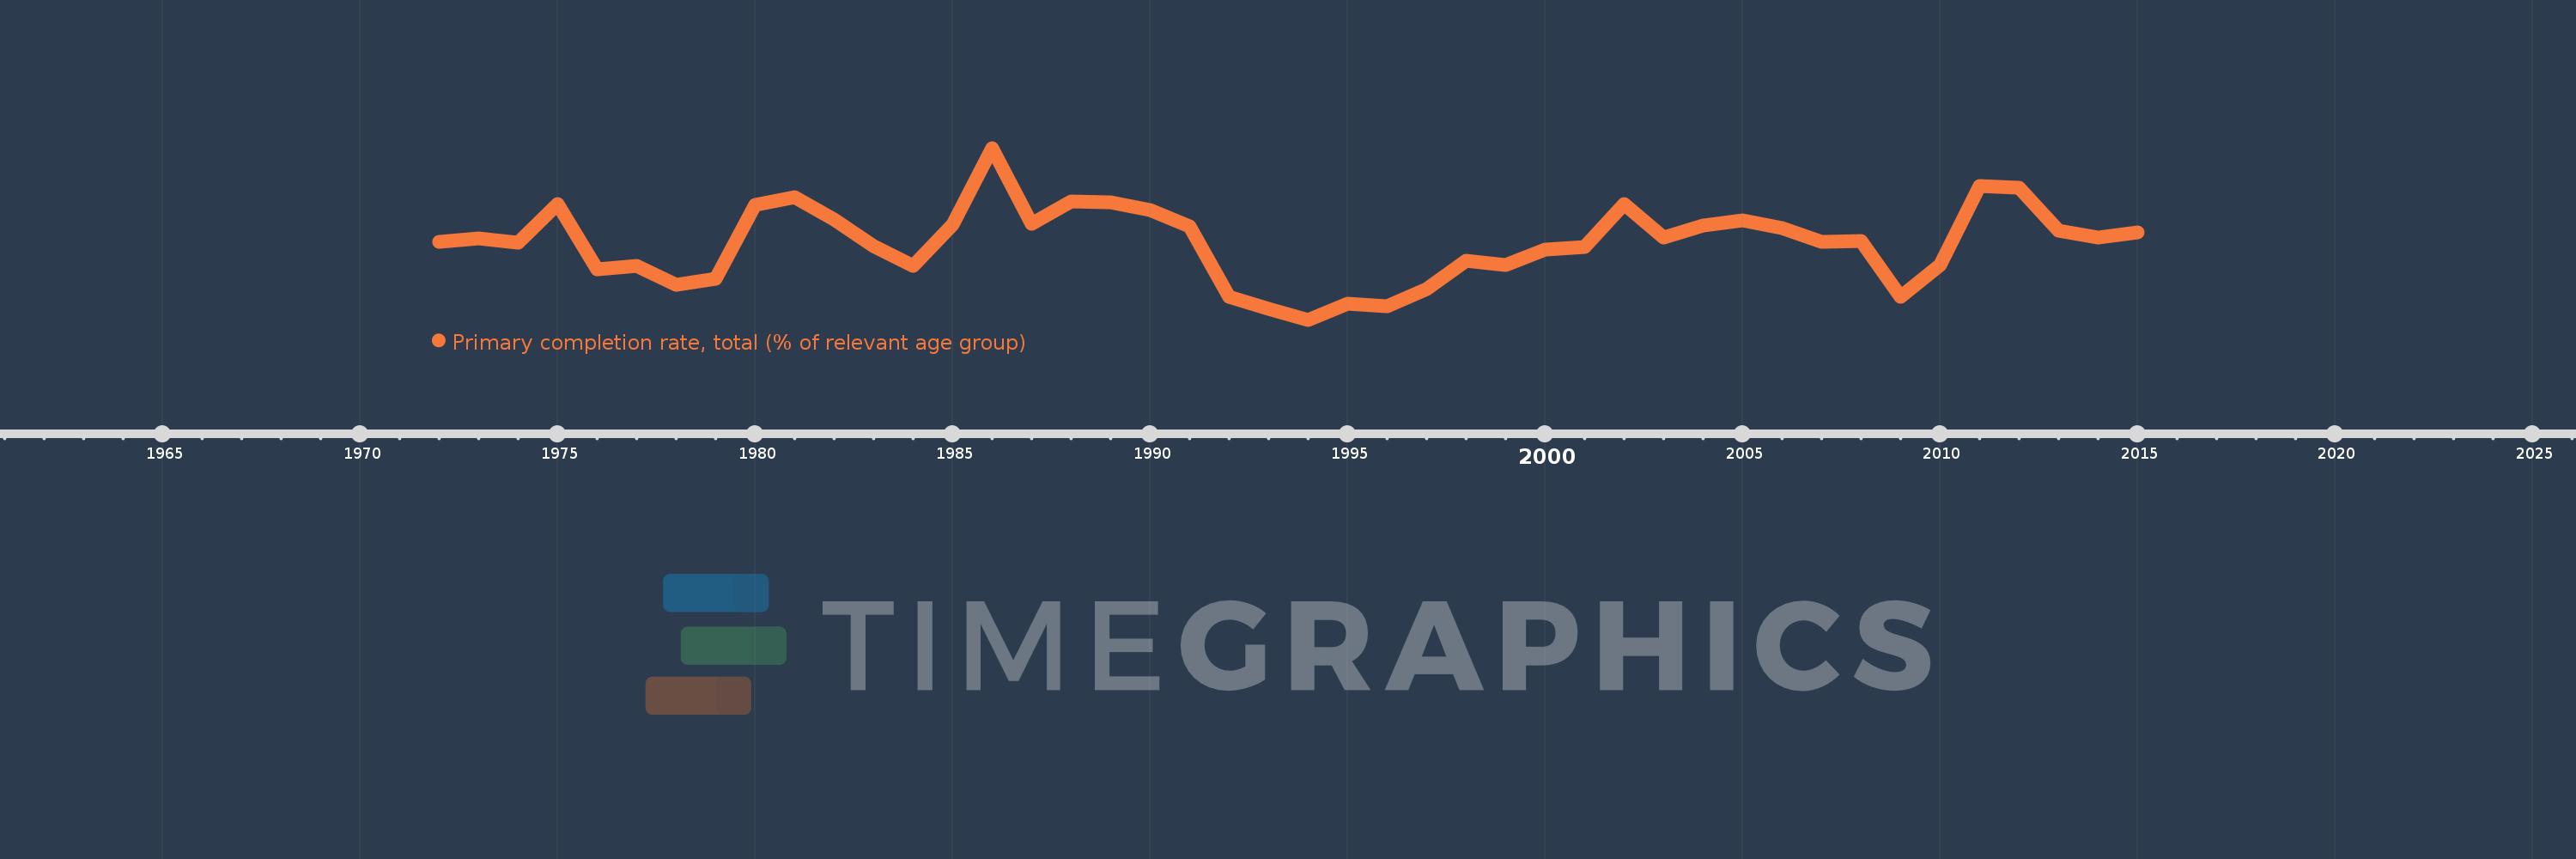
Primary completion rate, total (% of relevant age group)
2015,2014,2013,2012,2011,2010,2009,2008,2007,2006,2005,2004,2003,2002,2001,2000,1999,1998,1997,1996,1995,1994,1993,1992,1991,1990,1989,1988,1987,1986,1985,1984,1983,1982,1981,1980,1979,1978,1977,1976,1975,1974,1973,1972
This statistics in other country:
AfghanistanAlbaniaAlgeriaAngolaAntigua and BarbudaArab WorldArgentinaArmeniaArubaAustriaAzerbaijanBahamas, TheBahrainBangladeshBarbadosBelarusBelgiumBelizeBeninBermudaBhutanBoliviaBosnia and HerzegovinaBotswanaBrazilBritish Virgin IslandsBrunei DarussalamBulgariaBurkina FasoBurundiCabo VerdeCambodiaCameroonCanadaCaribbean small statesCentral African RepublicCentral Europe and the BalticsChadChileChinaColombiaComorosCongo, Dem. Rep.Congo, Rep.Costa RicaCote d'IvoireCroatiaCubaCyprusCzech RepublicDenmarkDjiboutiDominicaDominican RepublicEarly-demographic dividendEast Asia & PacificEast Asia & Pacific (excluding high income)East Asia & Pacific (IDA & IBRD countries)EcuadorEgypt, Arab Rep.El SalvadorEquatorial GuineaEritreaEstoniaEthiopiaEuro areaEurope & Central AsiaEurope & Central Asia (excluding high income)Europe & Central Asia (IDA & IBRD countries)European UnionFijiFinlandFragile and conflict affected situationsFranceGabonGambia, TheGeorgiaGermanyGhanaGreeceGrenadaGuatemalaGuineaGuinea-BissauGuyanaHaitiHeavily indebted poor countries (HIPC)High incomeHondurasHong Kong SAR, ChinaHungaryIBRD onlyIcelandIDA & IBRD totalIDA blendIDA onlyIDA totalIndiaIndonesiaIran, Islamic Rep.IraqIrelandIsraelItalyJamaicaJapanJordanKazakhstanKenyaKiribatiKorea, Dem. People’s Rep.Korea, Rep.KuwaitKyrgyz RepublicLao PDRLate-demographic dividendLatin America & Caribbean Latin America & Caribbean (excluding high income)Latin America & the Caribbean (IDA & IBRD countries)LatviaLeast developed countries: UN classificationLebanonLesothoLiberiaLibyaLiechtensteinLithuaniaLow & middle incomeLow incomeLower middle incomeLuxembourgMacao SAR, ChinaMacedonia, FYRMadagascarMalawiMalaysiaMaldivesMaliMaltaMarshall IslandsMauritaniaMauritiusMexicoMiddle East & North AfricaMiddle East & North Africa (excluding high income)Middle East & North Africa (IDA & IBRD countries)Middle incomeMoldovaMongoliaMontenegroMoroccoMozambiqueMyanmarNamibiaNauruNepalNetherlandsNew ZealandNicaraguaNigerNigeriaNorwayOECD membersOmanOther small statesPacific island small statesPakistanPalauPanamaPapua New GuineaParaguayPeruPhilippinesPolandPortugalPost-demographic dividendPre-demographic dividendQatarRomaniaRussian FederationRwandaSamoaSan MarinoSao Tome and PrincipeSaudi ArabiaSenegalSerbiaSeychellesSierra LeoneSlovak RepublicSloveniaSmall statesSolomon IslandsSouth AfricaSouth AsiaSouth Asia (IDA & IBRD)South SudanSpainSri LankaSt. Kitts and NevisSt. LuciaSt. Vincent and the GrenadinesSub-Saharan Africa Sub-Saharan Africa (excluding high income)Sub-Saharan Africa (IDA & IBRD countries)SudanSurinameSwazilandSwedenSwitzerlandSyrian Arab RepublicTajikistanTanzaniaThailandTimor-LesteTogoTongaTrinidad and TobagoTunisiaTurkeyTuvaluUgandaUkraineUnited Arab EmiratesUpper middle incomeUruguayUzbekistanVanuatuVenezuela, RBVietnamWest Bank and GazaWorldYemen, Rep.ZambiaZimbabwe Timeline:
This timeline shows a graph from 1972 to 2015 of Bulgaria. No data until 1971. Number of actual observations by date: 44.
Source name:
World Development Indicators
Source organization:
United Nations Educational, Scientific, and Cultural Organization (UNESCO) Institute for Statistics.
Categories, topics:
Aid Effectiveness, Climate Change, Education
Last updated:
apr 23, 2017
Indicators value changes by year
Minimum:
86.377
jan 1, 1994
Maximum:
110.55
jan 1, 1986
At the date of observation
Value
Absolute change
Change from previous value
jan 1, 1972
97.331
+97.331
0.0%
jan 1, 1973
97.86
+0.53
0.54%
jan 1, 1974
97.264
-0.597
-0.61%
jan 1, 1975
102.604
+5.341
5.49%
jan 1, 1976
93.498
-9.107
-8.88%
jan 1, 1977
93.954
+0.456
0.49%
jan 1, 1978
91.334
-2.62
-2.79%
jan 1, 1979
92.165
+0.83
0.91%
jan 1, 1980
102.564
+10.4
11.28%
jan 1, 1981
103.573
+1.008
0.98%
jan 1, 1982
100.427
-3.146
-3.04%
jan 1, 1983
96.758
-3.669
-3.65%
jan 1, 1984
93.915
-2.843
-2.94%
jan 1, 1985
99.741
+5.826
6.2%
jan 1, 1986
110.55
+10.808
10.84%
jan 1, 1987
99.845
-10.704
-9.68%
jan 1, 1988
103.049
+3.204
3.21%
jan 1, 1989
102.84
-0.209
-0.2%
jan 1, 1990
101.79
-1.05
-1.02%
jan 1, 1991
99.493
-2.297
-2.26%
jan 1, 1992
89.597
-9.896
-9.95%
jan 1, 1993
87.884
-1.714
-1.91%
jan 1, 1994
86.377
-1.507
-1.71%
jan 1, 1995
88.613
+2.236
2.59%
jan 1, 1996
88.275
-0.338
-0.38%
jan 1, 1997
90.708
+2.433
2.76%
jan 1, 1998
94.701
+3.993
4.4%
jan 1, 1999
94.111
-0.59
-0.62%
jan 1, 2000
96.285
+2.174
2.31%
jan 1, 2001
96.586
+0.301
0.31%
jan 1, 2002
102.623
+6.038
6.25%
jan 1, 2003
97.931
-4.693
-4.57%
jan 1, 2004
99.596
+1.665
1.7%
jan 1, 2005
100.413
+0.818
0.82%
jan 1, 2006
99.223
-1.19
-1.18%
jan 1, 2007
97.382
-1.841
-1.86%
jan 1, 2008
97.486
+0.103
0.11%
jan 1, 2009
89.617
-7.868
-8.07%
jan 1, 2010
94.117
+4.499
5.02%
jan 1, 2011
105.163
+11.046
11.74%
jan 1, 2012
104.923
-0.24
-0.23%
jan 1, 2013
98.949
-5.974
-5.69%
jan 1, 2014
97.97
-0.979
-0.99%
jan 1, 2015
98.675
+0.704
0.72%
Ranking of countries by current statistics by years


Comments: