29
/
en
AIzaSyAYiBZKx7MnpbEhh9jyipgxe19OcubqV5w
April 1, 2024
148516
Guyana
GUY
true
2
1
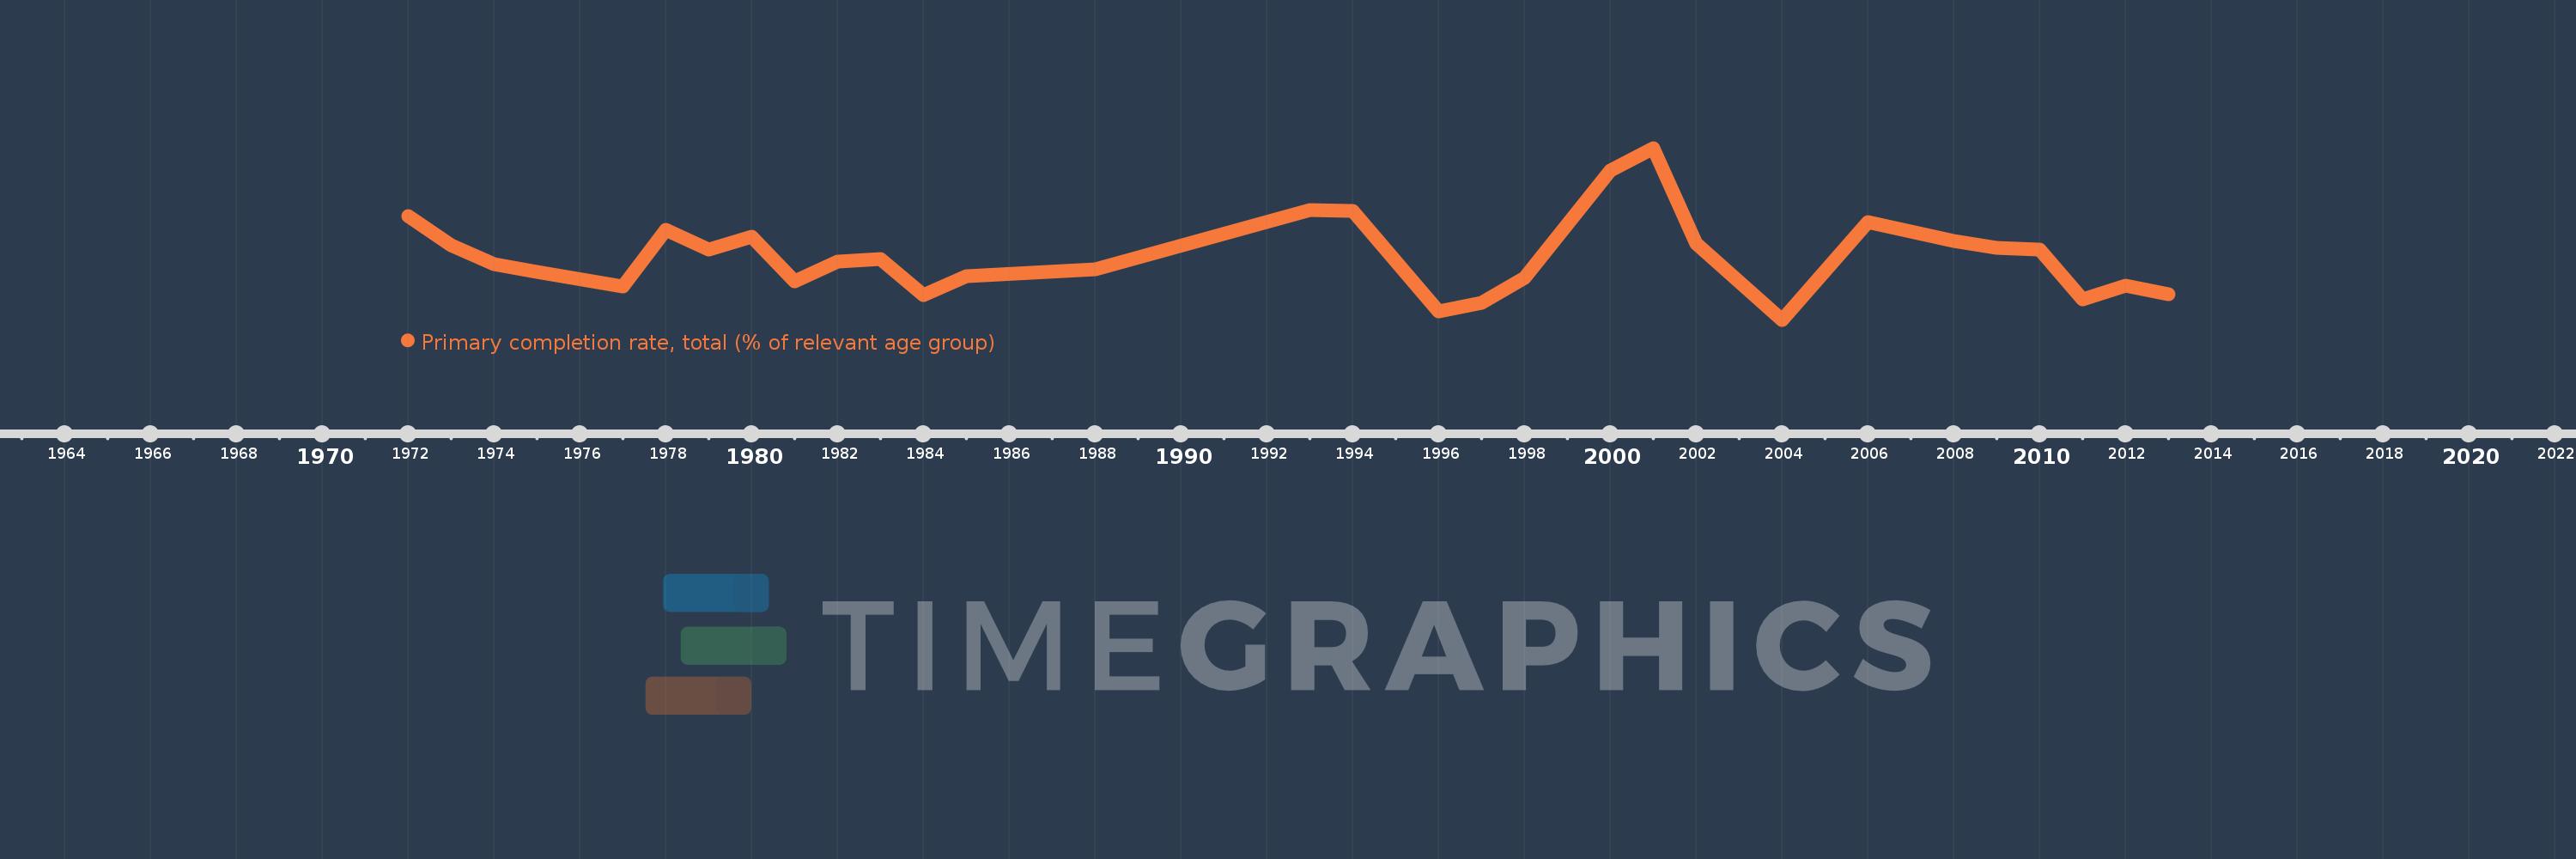
Primary completion rate, total (% of relevant age group)
2013,2012,2011,2010,2009,2008,2007,2006,2004,2002,2001,2000,1998,1997,1996,1994,1993,1988,1985,1984,1983,1982,1981,1980,1979,1978,1977,1975,1974,1973,1972
This statistics in other country:
AfghanistanAlbaniaAlgeriaAngolaAntigua and BarbudaArab WorldArgentinaArmeniaArubaAustriaAzerbaijanBahamas, TheBahrainBangladeshBarbadosBelarusBelgiumBelizeBeninBermudaBhutanBoliviaBosnia and HerzegovinaBotswanaBrazilBritish Virgin IslandsBrunei DarussalamBulgariaBurkina FasoBurundiCabo VerdeCambodiaCameroonCanadaCaribbean small statesCentral African RepublicCentral Europe and the BalticsChadChileChinaColombiaComorosCongo, Dem. Rep.Congo, Rep.Costa RicaCote d'IvoireCroatiaCubaCyprusCzech RepublicDenmarkDjiboutiDominicaDominican RepublicEarly-demographic dividendEast Asia & PacificEast Asia & Pacific (excluding high income)East Asia & Pacific (IDA & IBRD countries)EcuadorEgypt, Arab Rep.El SalvadorEquatorial GuineaEritreaEstoniaEthiopiaEuro areaEurope & Central AsiaEurope & Central Asia (excluding high income)Europe & Central Asia (IDA & IBRD countries)European UnionFijiFinlandFragile and conflict affected situationsFranceGabonGambia, TheGeorgiaGermanyGhanaGreeceGrenadaGuatemalaGuineaGuinea-BissauGuyanaHaitiHeavily indebted poor countries (HIPC)High incomeHondurasHong Kong SAR, ChinaHungaryIBRD onlyIcelandIDA & IBRD totalIDA blendIDA onlyIDA totalIndiaIndonesiaIran, Islamic Rep.IraqIrelandIsraelItalyJamaicaJapanJordanKazakhstanKenyaKiribatiKorea, Dem. People’s Rep.Korea, Rep.KuwaitKyrgyz RepublicLao PDRLate-demographic dividendLatin America & Caribbean Latin America & Caribbean (excluding high income)Latin America & the Caribbean (IDA & IBRD countries)LatviaLeast developed countries: UN classificationLebanonLesothoLiberiaLibyaLiechtensteinLithuaniaLow & middle incomeLow incomeLower middle incomeLuxembourgMacao SAR, ChinaMacedonia, FYRMadagascarMalawiMalaysiaMaldivesMaliMaltaMarshall IslandsMauritaniaMauritiusMexicoMiddle East & North AfricaMiddle East & North Africa (excluding high income)Middle East & North Africa (IDA & IBRD countries)Middle incomeMoldovaMongoliaMontenegroMoroccoMozambiqueMyanmarNamibiaNauruNepalNetherlandsNew ZealandNicaraguaNigerNigeriaNorwayOECD membersOmanOther small statesPacific island small statesPakistanPalauPanamaPapua New GuineaParaguayPeruPhilippinesPolandPortugalPost-demographic dividendPre-demographic dividendQatarRomaniaRussian FederationRwandaSamoaSan MarinoSao Tome and PrincipeSaudi ArabiaSenegalSerbiaSeychellesSierra LeoneSlovak RepublicSloveniaSmall statesSolomon IslandsSouth AfricaSouth AsiaSouth Asia (IDA & IBRD)South SudanSpainSri LankaSt. Kitts and NevisSt. LuciaSt. Vincent and the GrenadinesSub-Saharan Africa Sub-Saharan Africa (excluding high income)Sub-Saharan Africa (IDA & IBRD countries)SudanSurinameSwazilandSwedenSwitzerlandSyrian Arab RepublicTajikistanTanzaniaThailandTimor-LesteTogoTongaTrinidad and TobagoTunisiaTurkeyTuvaluUgandaUkraineUnited Arab EmiratesUpper middle incomeUruguayUzbekistanVanuatuVenezuela, RBVietnamWest Bank and GazaWorldYemen, Rep.ZambiaZimbabwe Timeline:
This timeline shows a graph from 1972 to 2013 of Guyana. No data until 1971. Number of actual observations by date: 31.
Source name:
World Development Indicators
Source organization:
United Nations Educational, Scientific, and Cultural Organization (UNESCO) Institute for Statistics.
Categories, topics:
Aid Effectiveness, Climate Change, Education
Last updated:
apr 23, 2017
Indicators value changes by year
Minimum:
79.994
jan 1, 2004
Maximum:
107.428
jan 1, 2001
At the date of observation
Value
Absolute change
Change from previous value
jan 1, 1972
96.492
+96.492
0.0%
jan 1, 1973
91.872
-4.62
-4.79%
jan 1, 1974
88.865
-3.007
-3.27%
jan 1, 1975
87.667
-1.199
-1.35%
jan 1, 1977
85.286
-2.381
-2.72%
jan 1, 1978
94.32
+9.034
10.59%
jan 1, 1979
91.137
-3.183
-3.37%
jan 1, 1980
93.251
+2.114
2.32%
jan 1, 1981
86.065
-7.187
-7.71%
jan 1, 1982
89.222
+3.158
3.67%
jan 1, 1983
89.702
+0.48
0.54%
jan 1, 1984
83.979
-5.724
-6.38%
jan 1, 1985
86.923
+2.944
3.51%
jan 1, 1988
87.998
+1.075
1.24%
jan 1, 1993
97.458
+9.46
10.75%
jan 1, 1994
97.348
-0.109
-0.11%
jan 1, 1996
81.388
-15.96
-16.4%
jan 1, 1997
82.742
+1.354
1.66%
jan 1, 1998
86.716
+3.974
4.8%
jan 1, 2000
103.848
+17.132
19.76%
jan 1, 2001
107.428
+3.58
3.45%
jan 1, 2002
92.184
-15.243
-14.19%
jan 1, 2004
79.994
-12.19
-13.22%
jan 1, 2006
95.546
+15.552
19.44%
jan 1, 2007
94.104
-1.442
-1.51%
jan 1, 2008
92.544
-1.56
-1.66%
jan 1, 2009
91.489
-1.054
-1.14%
jan 1, 2010
91.267
-0.222
-0.24%
jan 1, 2011
83.227
-8.041
-8.81%
jan 1, 2012
85.434
+2.208
2.65%
jan 1, 2013
84.071
-1.364
-1.6%
Ranking of countries by current statistics by years


Comments: