29
/
en
AIzaSyAYiBZKx7MnpbEhh9jyipgxe19OcubqV5w
April 1, 2024
157865
Iran, Islamic Rep.
IRN
true
2
1
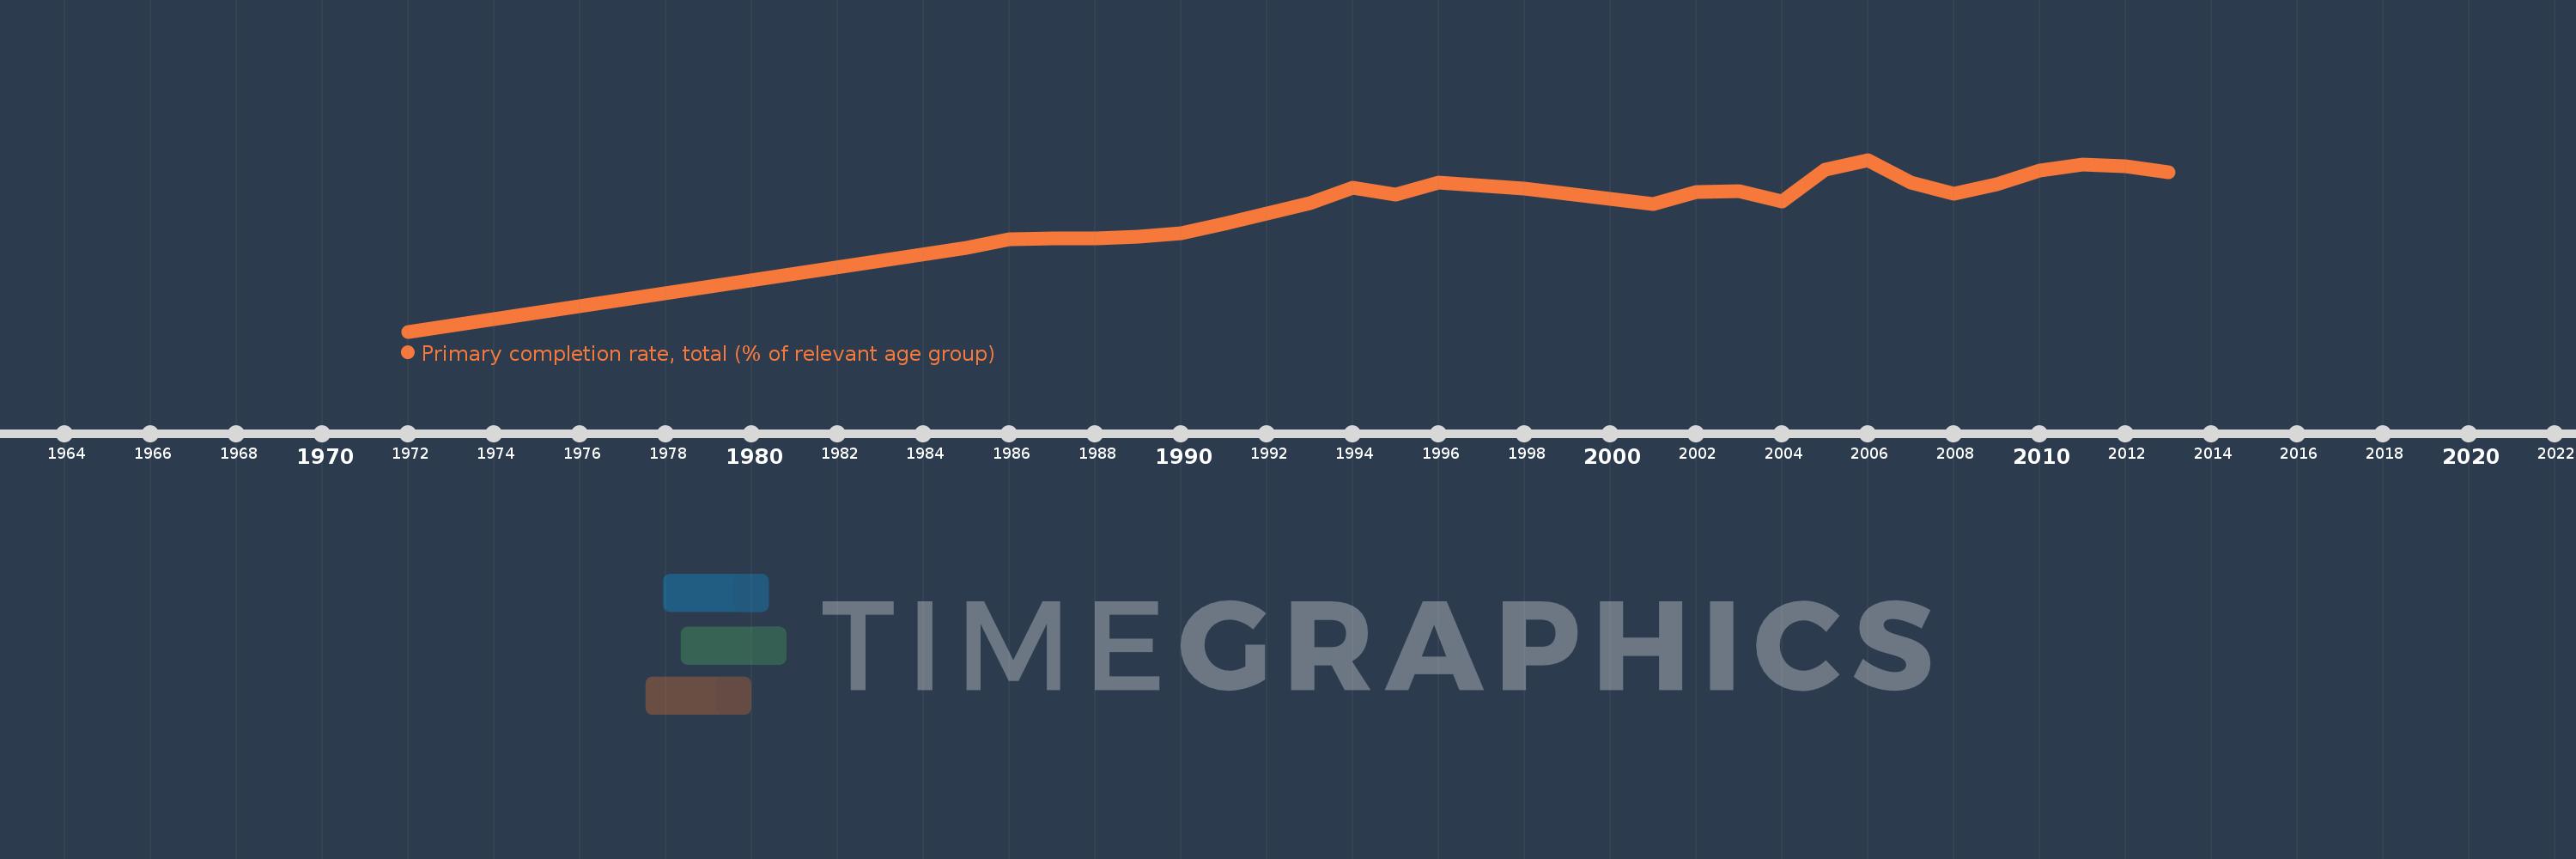
Primary completion rate, total (% of relevant age group)
2013,2012,2011,2010,2009,2008,2007,2006,2005,2004,2003,2002,2001,1998,1996,1995,1994,1993,1992,1991,1990,1989,1988,1987,1986,1985,1972
This statistics in other country:
AfghanistanAlbaniaAlgeriaAngolaAntigua and BarbudaArab WorldArgentinaArmeniaArubaAustriaAzerbaijanBahamas, TheBahrainBangladeshBarbadosBelarusBelgiumBelizeBeninBermudaBhutanBoliviaBosnia and HerzegovinaBotswanaBrazilBritish Virgin IslandsBrunei DarussalamBulgariaBurkina FasoBurundiCabo VerdeCambodiaCameroonCanadaCaribbean small statesCentral African RepublicCentral Europe and the BalticsChadChileChinaColombiaComorosCongo, Dem. Rep.Congo, Rep.Costa RicaCote d'IvoireCroatiaCubaCyprusCzech RepublicDenmarkDjiboutiDominicaDominican RepublicEarly-demographic dividendEast Asia & PacificEast Asia & Pacific (excluding high income)East Asia & Pacific (IDA & IBRD countries)EcuadorEgypt, Arab Rep.El SalvadorEquatorial GuineaEritreaEstoniaEthiopiaEuro areaEurope & Central AsiaEurope & Central Asia (excluding high income)Europe & Central Asia (IDA & IBRD countries)European UnionFijiFinlandFragile and conflict affected situationsFranceGabonGambia, TheGeorgiaGermanyGhanaGreeceGrenadaGuatemalaGuineaGuinea-BissauGuyanaHaitiHeavily indebted poor countries (HIPC)High incomeHondurasHong Kong SAR, ChinaHungaryIBRD onlyIcelandIDA & IBRD totalIDA blendIDA onlyIDA totalIndiaIndonesiaIran, Islamic Rep.IraqIrelandIsraelItalyJamaicaJapanJordanKazakhstanKenyaKiribatiKorea, Dem. People’s Rep.Korea, Rep.KuwaitKyrgyz RepublicLao PDRLate-demographic dividendLatin America & Caribbean Latin America & Caribbean (excluding high income)Latin America & the Caribbean (IDA & IBRD countries)LatviaLeast developed countries: UN classificationLebanonLesothoLiberiaLibyaLiechtensteinLithuaniaLow & middle incomeLow incomeLower middle incomeLuxembourgMacao SAR, ChinaMacedonia, FYRMadagascarMalawiMalaysiaMaldivesMaliMaltaMarshall IslandsMauritaniaMauritiusMexicoMiddle East & North AfricaMiddle East & North Africa (excluding high income)Middle East & North Africa (IDA & IBRD countries)Middle incomeMoldovaMongoliaMontenegroMoroccoMozambiqueMyanmarNamibiaNauruNepalNetherlandsNew ZealandNicaraguaNigerNigeriaNorwayOECD membersOmanOther small statesPacific island small statesPakistanPalauPanamaPapua New GuineaParaguayPeruPhilippinesPolandPortugalPost-demographic dividendPre-demographic dividendQatarRomaniaRussian FederationRwandaSamoaSan MarinoSao Tome and PrincipeSaudi ArabiaSenegalSerbiaSeychellesSierra LeoneSlovak RepublicSloveniaSmall statesSolomon IslandsSouth AfricaSouth AsiaSouth Asia (IDA & IBRD)South SudanSpainSri LankaSt. Kitts and NevisSt. LuciaSt. Vincent and the GrenadinesSub-Saharan Africa Sub-Saharan Africa (excluding high income)Sub-Saharan Africa (IDA & IBRD countries)SudanSurinameSwazilandSwedenSwitzerlandSyrian Arab RepublicTajikistanTanzaniaThailandTimor-LesteTogoTongaTrinidad and TobagoTunisiaTurkeyTuvaluUgandaUkraineUnited Arab EmiratesUpper middle incomeUruguayUzbekistanVanuatuVenezuela, RBVietnamWest Bank and GazaWorldYemen, Rep.ZambiaZimbabwe Timeline:
This timeline shows a graph from 1972 to 2013 of Iran, Islamic Rep.. No data until 1971. Number of actual observations by date: 27.
Source name:
World Development Indicators
Source organization:
United Nations Educational, Scientific, and Cultural Organization (UNESCO) Institute for Statistics.
Categories, topics:
Aid Effectiveness, Climate Change, Education
Last updated:
apr 23, 2017
Indicators value changes by year
Minimum:
50.122
jan 1, 1972
Maximum:
106.365
jan 1, 2006
At the date of observation
Value
Absolute change
Change from previous value
jan 1, 1972
50.122
+50.122
0.0%
jan 1, 1985
77.603
+27.481
54.83%
jan 1, 1986
80.336
+2.733
3.52%
jan 1, 1987
80.704
+0.368
0.46%
jan 1, 1988
80.676
-0.028
-0.03%
jan 1, 1989
81.305
+0.629
0.78%
jan 1, 1990
82.231
+0.926
1.14%
jan 1, 1991
85.34
+3.109
3.78%
jan 1, 1992
88.829
+3.489
4.09%
jan 1, 1993
92.027
+3.198
3.6%
jan 1, 1994
97.233
+5.206
5.66%
jan 1, 1995
95.106
-2.127
-2.19%
jan 1, 1996
98.853
+3.747
3.94%
jan 1, 1998
96.973
-1.88
-1.9%
jan 1, 2001
92.021
-4.952
-5.11%
jan 1, 2002
95.828
+3.808
4.14%
jan 1, 2003
95.999
+0.17
0.18%
jan 1, 2004
92.63
-3.369
-3.51%
jan 1, 2005
103.251
+10.621
11.47%
jan 1, 2006
106.365
+3.114
3.02%
jan 1, 2007
98.843
-7.522
-7.07%
jan 1, 2008
95.127
-3.716
-3.76%
jan 1, 2009
98.244
+3.117
3.28%
jan 1, 2010
102.921
+4.677
4.76%
jan 1, 2011
104.828
+1.907
1.85%
jan 1, 2012
104.207
-0.621
-0.59%
jan 1, 2013
102.186
-2.021
-1.94%
Ranking of countries by current statistics by years


Comments: