29
/
en
AIzaSyAYiBZKx7MnpbEhh9jyipgxe19OcubqV5w
April 1, 2024
32989
Europe & Central Asia (IDA & IBRD countries)
TEC
false
2
1
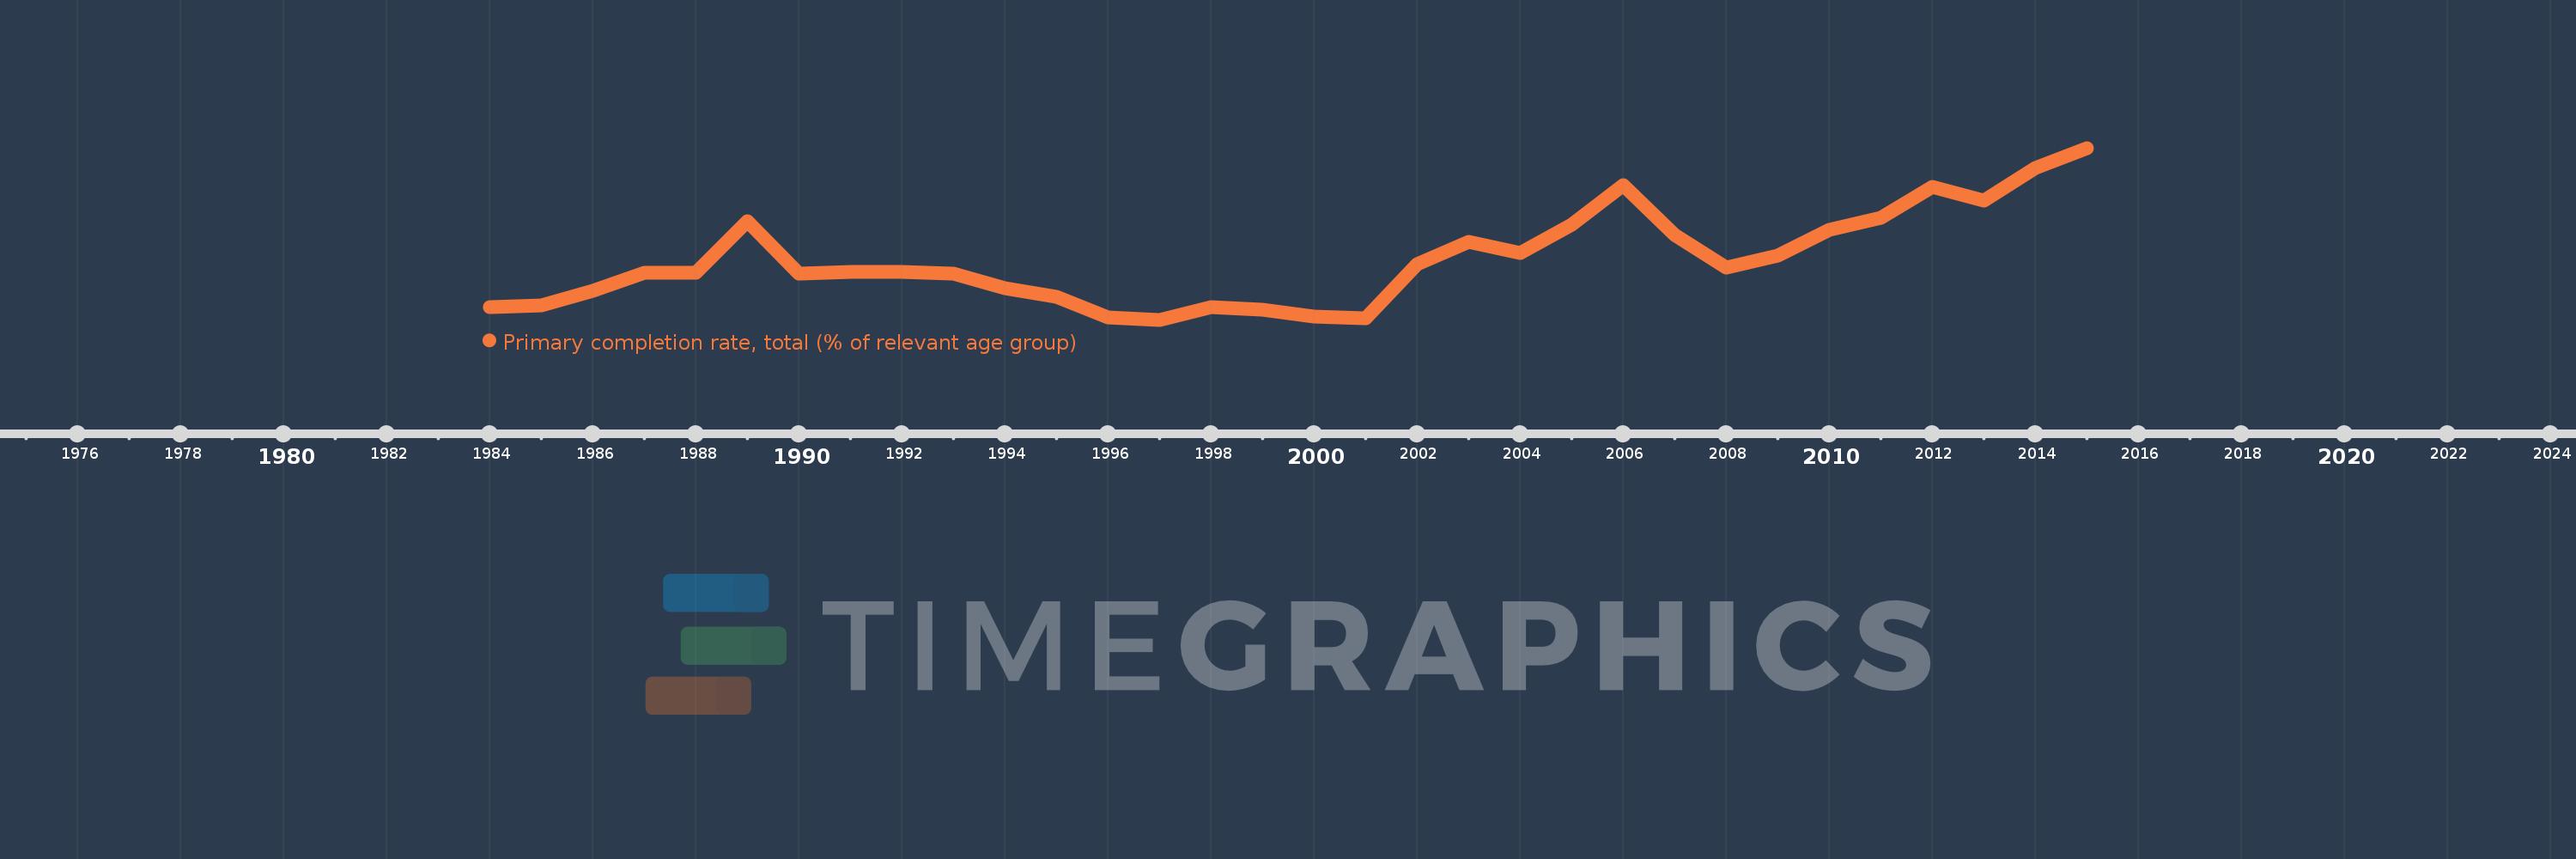
Primary completion rate, total (% of relevant age group)
2015,2014,2013,2012,2011,2010,2009,2008,2007,2006,2005,2004,2003,2002,2001,2000,1999,1998,1997,1996,1995,1994,1993,1992,1991,1990,1989,1988,1987,1986,1985,1984
This statistics in other country:
AfghanistanAlbaniaAlgeriaAngolaAntigua and BarbudaArab WorldArgentinaArmeniaArubaAustriaAzerbaijanBahamas, TheBahrainBangladeshBarbadosBelarusBelgiumBelizeBeninBermudaBhutanBoliviaBosnia and HerzegovinaBotswanaBrazilBritish Virgin IslandsBrunei DarussalamBulgariaBurkina FasoBurundiCabo VerdeCambodiaCameroonCanadaCaribbean small statesCentral African RepublicCentral Europe and the BalticsChadChileChinaColombiaComorosCongo, Dem. Rep.Congo, Rep.Costa RicaCote d'IvoireCroatiaCubaCyprusCzech RepublicDenmarkDjiboutiDominicaDominican RepublicEarly-demographic dividendEast Asia & PacificEast Asia & Pacific (excluding high income)East Asia & Pacific (IDA & IBRD countries)EcuadorEgypt, Arab Rep.El SalvadorEquatorial GuineaEritreaEstoniaEthiopiaEuro areaEurope & Central AsiaEurope & Central Asia (excluding high income)Europe & Central Asia (IDA & IBRD countries)European UnionFijiFinlandFragile and conflict affected situationsFranceGabonGambia, TheGeorgiaGermanyGhanaGreeceGrenadaGuatemalaGuineaGuinea-BissauGuyanaHaitiHeavily indebted poor countries (HIPC)High incomeHondurasHong Kong SAR, ChinaHungaryIBRD onlyIcelandIDA & IBRD totalIDA blendIDA onlyIDA totalIndiaIndonesiaIran, Islamic Rep.IraqIrelandIsraelItalyJamaicaJapanJordanKazakhstanKenyaKiribatiKorea, Dem. People’s Rep.Korea, Rep.KuwaitKyrgyz RepublicLao PDRLate-demographic dividendLatin America & Caribbean Latin America & Caribbean (excluding high income)Latin America & the Caribbean (IDA & IBRD countries)LatviaLeast developed countries: UN classificationLebanonLesothoLiberiaLibyaLiechtensteinLithuaniaLow & middle incomeLow incomeLower middle incomeLuxembourgMacao SAR, ChinaMacedonia, FYRMadagascarMalawiMalaysiaMaldivesMaliMaltaMarshall IslandsMauritaniaMauritiusMexicoMiddle East & North AfricaMiddle East & North Africa (excluding high income)Middle East & North Africa (IDA & IBRD countries)Middle incomeMoldovaMongoliaMontenegroMoroccoMozambiqueMyanmarNamibiaNauruNepalNetherlandsNew ZealandNicaraguaNigerNigeriaNorwayOECD membersOmanOther small statesPacific island small statesPakistanPalauPanamaPapua New GuineaParaguayPeruPhilippinesPolandPortugalPost-demographic dividendPre-demographic dividendQatarRomaniaRussian FederationRwandaSamoaSan MarinoSao Tome and PrincipeSaudi ArabiaSenegalSerbiaSeychellesSierra LeoneSlovak RepublicSloveniaSmall statesSolomon IslandsSouth AfricaSouth AsiaSouth Asia (IDA & IBRD)South SudanSpainSri LankaSt. Kitts and NevisSt. LuciaSt. Vincent and the GrenadinesSub-Saharan Africa Sub-Saharan Africa (excluding high income)Sub-Saharan Africa (IDA & IBRD countries)SudanSurinameSwazilandSwedenSwitzerlandSyrian Arab RepublicTajikistanTanzaniaThailandTimor-LesteTogoTongaTrinidad and TobagoTunisiaTurkeyTuvaluUgandaUkraineUnited Arab EmiratesUpper middle incomeUruguayUzbekistanVanuatuVenezuela, RBVietnamWest Bank and GazaWorldYemen, Rep.ZambiaZimbabwe Timeline:
This timeline shows a graph from 1984 to 2015 of Europe & Central Asia (IDA & IBRD countries). No data until 1983. Number of actual observations by date: 32.
Source name:
World Development Indicators
Source organization:
United Nations Educational, Scientific, and Cultural Organization (UNESCO) Institute for Statistics.
Categories, topics:
Aid Effectiveness, Climate Change, Education
Last updated:
apr 23, 2017
Indicators value changes by year
Minimum:
93.633
jan 1, 1997
Maximum:
100.658
jan 1, 2015
At the date of observation
Value
Absolute change
Change from previous value
jan 1, 1984
94.166
+94.166
0.0%
jan 1, 1985
94.211
+0.045
0.05%
jan 1, 1986
94.814
+0.603
0.64%
jan 1, 1987
95.548
+0.734
0.77%
jan 1, 1988
95.559
+0.01
0.01%
jan 1, 1989
97.678
+2.12
2.22%
jan 1, 1990
95.523
-2.156
-2.21%
jan 1, 1991
95.598
+0.075
0.08%
jan 1, 1992
95.59
-0.008
-0.01%
jan 1, 1993
95.505
-0.085
-0.09%
jan 1, 1994
94.932
-0.572
-0.6%
jan 1, 1995
94.579
-0.353
-0.37%
jan 1, 1996
93.715
-0.864
-0.91%
jan 1, 1997
93.633
-0.082
-0.09%
jan 1, 1998
94.148
+0.516
0.55%
jan 1, 1999
94.041
-0.107
-0.11%
jan 1, 2000
93.758
-0.284
-0.3%
jan 1, 2001
93.705
-0.053
-0.06%
jan 1, 2002
95.907
+2.202
2.35%
jan 1, 2003
96.826
+0.919
0.96%
jan 1, 2004
96.346
-0.479
-0.5%
jan 1, 2005
97.504
+1.158
1.2%
jan 1, 2006
99.12
+1.617
1.66%
jan 1, 2007
97.115
-2.005
-2.02%
jan 1, 2008
95.777
-1.338
-1.38%
jan 1, 2009
96.263
+0.486
0.51%
jan 1, 2010
97.304
+1.041
1.08%
jan 1, 2011
97.804
+0.5
0.51%
jan 1, 2012
99.065
+1.261
1.29%
jan 1, 2013
98.51
-0.555
-0.56%
jan 1, 2014
99.828
+1.319
1.34%
jan 1, 2015
100.658
+0.829
0.83%
Ranking of countries by current statistics by years


Comments: