29
/
en
AIzaSyAYiBZKx7MnpbEhh9jyipgxe19OcubqV5w
April 1, 2024
59298
Sub-Saharan Africa
SSF
false
2
1
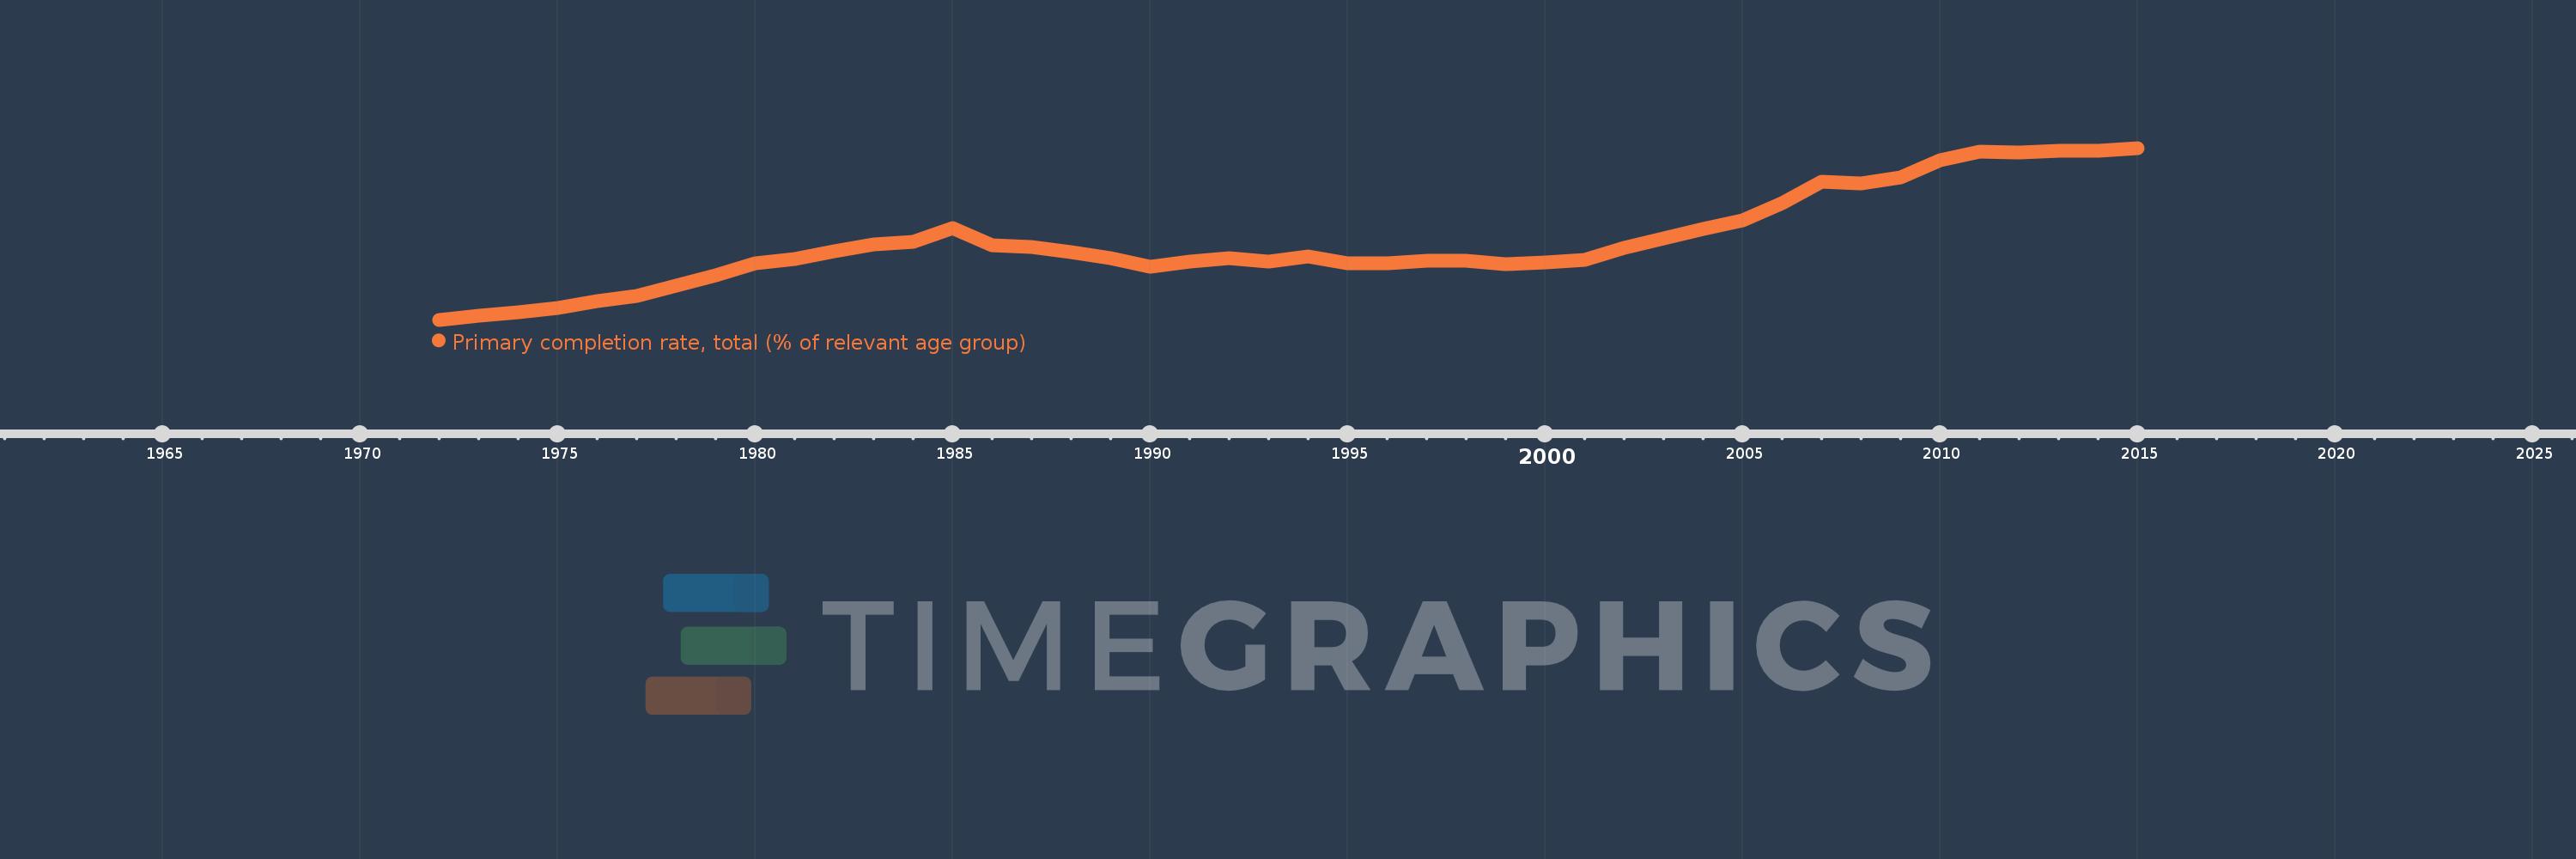
Primary completion rate, total (% of relevant age group)
2015,2014,2013,2012,2011,2010,2009,2008,2007,2006,2005,2004,2003,2002,2001,2000,1999,1998,1997,1996,1995,1994,1993,1992,1991,1990,1989,1988,1987,1986,1985,1984,1983,1982,1981,1980,1979,1978,1977,1976,1975,1974,1973,1972
This statistics in other country:
AfghanistanAlbaniaAlgeriaAngolaAntigua and BarbudaArab WorldArgentinaArmeniaArubaAustriaAzerbaijanBahamas, TheBahrainBangladeshBarbadosBelarusBelgiumBelizeBeninBermudaBhutanBoliviaBosnia and HerzegovinaBotswanaBrazilBritish Virgin IslandsBrunei DarussalamBulgariaBurkina FasoBurundiCabo VerdeCambodiaCameroonCanadaCaribbean small statesCentral African RepublicCentral Europe and the BalticsChadChileChinaColombiaComorosCongo, Dem. Rep.Congo, Rep.Costa RicaCote d'IvoireCroatiaCubaCyprusCzech RepublicDenmarkDjiboutiDominicaDominican RepublicEarly-demographic dividendEast Asia & PacificEast Asia & Pacific (excluding high income)East Asia & Pacific (IDA & IBRD countries)EcuadorEgypt, Arab Rep.El SalvadorEquatorial GuineaEritreaEstoniaEthiopiaEuro areaEurope & Central AsiaEurope & Central Asia (excluding high income)Europe & Central Asia (IDA & IBRD countries)European UnionFijiFinlandFragile and conflict affected situationsFranceGabonGambia, TheGeorgiaGermanyGhanaGreeceGrenadaGuatemalaGuineaGuinea-BissauGuyanaHaitiHeavily indebted poor countries (HIPC)High incomeHondurasHong Kong SAR, ChinaHungaryIBRD onlyIcelandIDA & IBRD totalIDA blendIDA onlyIDA totalIndiaIndonesiaIran, Islamic Rep.IraqIrelandIsraelItalyJamaicaJapanJordanKazakhstanKenyaKiribatiKorea, Dem. People’s Rep.Korea, Rep.KuwaitKyrgyz RepublicLao PDRLate-demographic dividendLatin America & Caribbean Latin America & Caribbean (excluding high income)Latin America & the Caribbean (IDA & IBRD countries)LatviaLeast developed countries: UN classificationLebanonLesothoLiberiaLibyaLiechtensteinLithuaniaLow & middle incomeLow incomeLower middle incomeLuxembourgMacao SAR, ChinaMacedonia, FYRMadagascarMalawiMalaysiaMaldivesMaliMaltaMarshall IslandsMauritaniaMauritiusMexicoMiddle East & North AfricaMiddle East & North Africa (excluding high income)Middle East & North Africa (IDA & IBRD countries)Middle incomeMoldovaMongoliaMontenegroMoroccoMozambiqueMyanmarNamibiaNauruNepalNetherlandsNew ZealandNicaraguaNigerNigeriaNorwayOECD membersOmanOther small statesPacific island small statesPakistanPalauPanamaPapua New GuineaParaguayPeruPhilippinesPolandPortugalPost-demographic dividendPre-demographic dividendQatarRomaniaRussian FederationRwandaSamoaSan MarinoSao Tome and PrincipeSaudi ArabiaSenegalSerbiaSeychellesSierra LeoneSlovak RepublicSloveniaSmall statesSolomon IslandsSouth AfricaSouth AsiaSouth Asia (IDA & IBRD)South SudanSpainSri LankaSt. Kitts and NevisSt. LuciaSt. Vincent and the GrenadinesSub-Saharan Africa Sub-Saharan Africa (excluding high income)Sub-Saharan Africa (IDA & IBRD countries)SudanSurinameSwazilandSwedenSwitzerlandSyrian Arab RepublicTajikistanTanzaniaThailandTimor-LesteTogoTongaTrinidad and TobagoTunisiaTurkeyTuvaluUgandaUkraineUnited Arab EmiratesUpper middle incomeUruguayUzbekistanVanuatuVenezuela, RBVietnamWest Bank and GazaWorldYemen, Rep.ZambiaZimbabwe Timeline:
This timeline shows a graph from 1972 to 2015 of Sub-Saharan Africa . No data until 1971. Number of actual observations by date: 44.
Source name:
World Development Indicators
Source organization:
United Nations Educational, Scientific, and Cultural Organization (UNESCO) Institute for Statistics.
Categories, topics:
Aid Effectiveness, Climate Change, Education
Last updated:
apr 23, 2017
Indicators value changes by year
Minimum:
46.031
jan 1, 1972
Maximum:
68.639
jan 1, 2015
At the date of observation
Value
Absolute change
Change from previous value
jan 1, 1972
46.031
+46.031
0.0%
jan 1, 1973
46.532
+0.501
1.09%
jan 1, 1974
47.032
+0.499
1.07%
jan 1, 1975
47.554
+0.522
1.11%
jan 1, 1976
48.493
+0.939
1.97%
jan 1, 1977
49.217
+0.724
1.49%
jan 1, 1978
50.473
+1.257
2.55%
jan 1, 1979
51.871
+1.398
2.77%
jan 1, 1980
53.448
+1.576
3.04%
jan 1, 1981
54.003
+0.555
1.04%
jan 1, 1982
55.066
+1.063
1.97%
jan 1, 1983
55.905
+0.839
1.52%
jan 1, 1984
56.269
+0.364
0.65%
jan 1, 1985
58.129
+1.86
3.31%
jan 1, 1986
55.791
-2.338
-4.02%
jan 1, 1987
55.586
-0.205
-0.37%
jan 1, 1988
54.943
-0.644
-1.16%
jan 1, 1989
54.159
-0.784
-1.43%
jan 1, 1990
53.045
-1.114
-2.06%
jan 1, 1991
53.633
+0.587
1.11%
jan 1, 1992
54.106
+0.474
0.88%
jan 1, 1993
53.665
-0.442
-0.82%
jan 1, 1994
54.36
+0.696
1.3%
jan 1, 1995
53.482
-0.878
-1.62%
jan 1, 1996
53.436
-0.045
-0.08%
jan 1, 1997
53.806
+0.37
0.69%
jan 1, 1998
53.809
+0.003
0.01%
jan 1, 1999
53.362
-0.447
-0.83%
jan 1, 2000
53.611
+0.25
0.47%
jan 1, 2001
53.878
+0.266
0.5%
jan 1, 2002
55.506
+1.628
3.02%
jan 1, 2003
56.778
+1.272
2.29%
jan 1, 2004
57.943
+1.166
2.05%
jan 1, 2005
59.143
+1.199
2.07%
jan 1, 2006
61.389
+2.247
3.8%
jan 1, 2007
64.202
+2.813
4.58%
jan 1, 2008
64.017
-0.185
-0.29%
jan 1, 2009
64.742
+0.725
1.13%
jan 1, 2010
66.968
+2.227
3.44%
jan 1, 2011
68.183
+1.215
1.81%
jan 1, 2012
68.06
-0.123
-0.18%
jan 1, 2013
68.263
+0.203
0.3%
jan 1, 2014
68.236
-0.027
-0.04%
jan 1, 2015
68.639
+0.403
0.59%
Ranking of countries by current statistics by years


Comments: