29
/
en
AIzaSyAYiBZKx7MnpbEhh9jyipgxe19OcubqV5w
April 1, 2024
161891
Italy
ITA
true
2
1
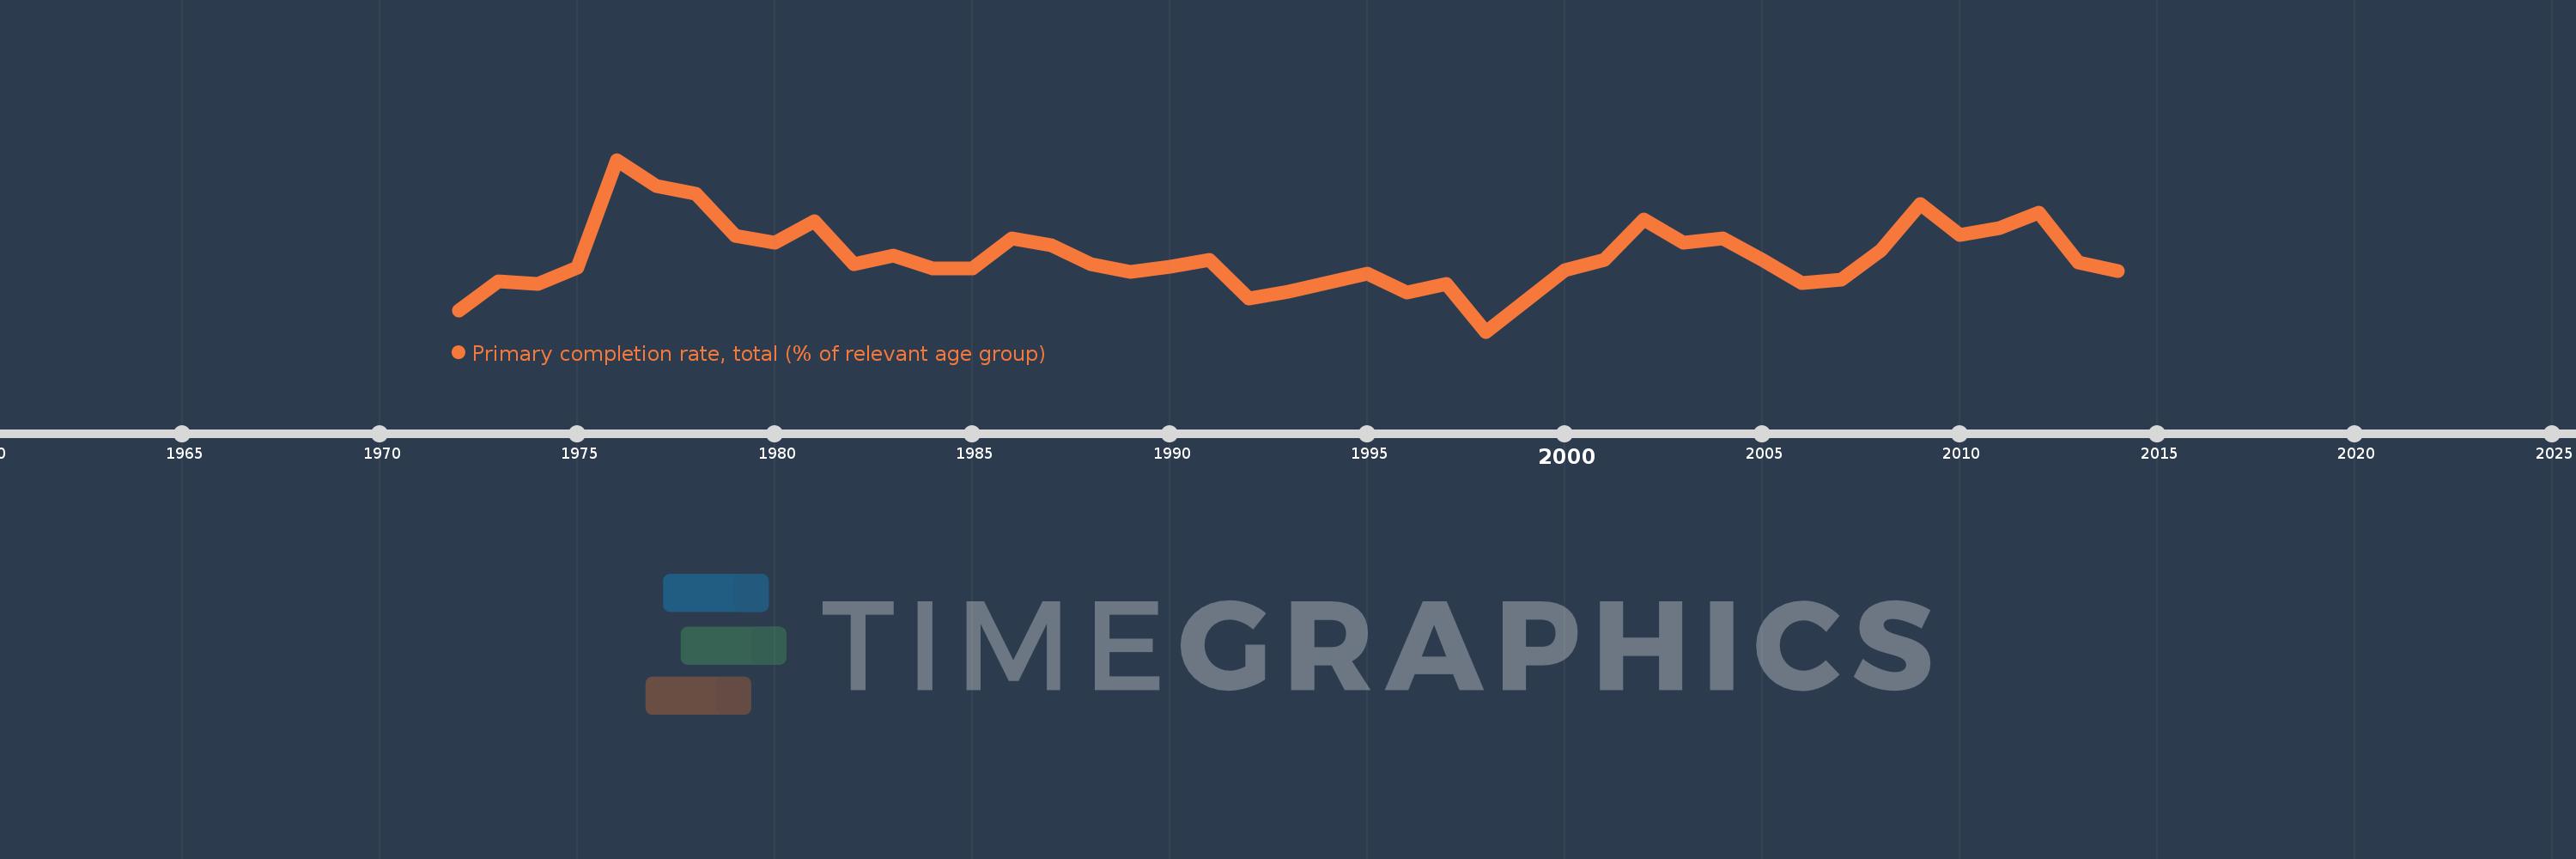
Primary completion rate, total (% of relevant age group)
2014,2013,2012,2011,2010,2009,2008,2007,2006,2005,2004,2003,2002,2001,2000,1998,1997,1996,1995,1993,1992,1991,1990,1989,1988,1987,1986,1985,1984,1983,1982,1981,1980,1979,1978,1977,1976,1975,1974,1973,1972
This statistics in other country:
AfghanistanAlbaniaAlgeriaAngolaAntigua and BarbudaArab WorldArgentinaArmeniaArubaAustriaAzerbaijanBahamas, TheBahrainBangladeshBarbadosBelarusBelgiumBelizeBeninBermudaBhutanBoliviaBosnia and HerzegovinaBotswanaBrazilBritish Virgin IslandsBrunei DarussalamBulgariaBurkina FasoBurundiCabo VerdeCambodiaCameroonCanadaCaribbean small statesCentral African RepublicCentral Europe and the BalticsChadChileChinaColombiaComorosCongo, Dem. Rep.Congo, Rep.Costa RicaCote d'IvoireCroatiaCubaCyprusCzech RepublicDenmarkDjiboutiDominicaDominican RepublicEarly-demographic dividendEast Asia & PacificEast Asia & Pacific (excluding high income)East Asia & Pacific (IDA & IBRD countries)EcuadorEgypt, Arab Rep.El SalvadorEquatorial GuineaEritreaEstoniaEthiopiaEuro areaEurope & Central AsiaEurope & Central Asia (excluding high income)Europe & Central Asia (IDA & IBRD countries)European UnionFijiFinlandFragile and conflict affected situationsFranceGabonGambia, TheGeorgiaGermanyGhanaGreeceGrenadaGuatemalaGuineaGuinea-BissauGuyanaHaitiHeavily indebted poor countries (HIPC)High incomeHondurasHong Kong SAR, ChinaHungaryIBRD onlyIcelandIDA & IBRD totalIDA blendIDA onlyIDA totalIndiaIndonesiaIran, Islamic Rep.IraqIrelandIsraelItalyJamaicaJapanJordanKazakhstanKenyaKiribatiKorea, Dem. People’s Rep.Korea, Rep.KuwaitKyrgyz RepublicLao PDRLate-demographic dividendLatin America & Caribbean Latin America & Caribbean (excluding high income)Latin America & the Caribbean (IDA & IBRD countries)LatviaLeast developed countries: UN classificationLebanonLesothoLiberiaLibyaLiechtensteinLithuaniaLow & middle incomeLow incomeLower middle incomeLuxembourgMacao SAR, ChinaMacedonia, FYRMadagascarMalawiMalaysiaMaldivesMaliMaltaMarshall IslandsMauritaniaMauritiusMexicoMiddle East & North AfricaMiddle East & North Africa (excluding high income)Middle East & North Africa (IDA & IBRD countries)Middle incomeMoldovaMongoliaMontenegroMoroccoMozambiqueMyanmarNamibiaNauruNepalNetherlandsNew ZealandNicaraguaNigerNigeriaNorwayOECD membersOmanOther small statesPacific island small statesPakistanPalauPanamaPapua New GuineaParaguayPeruPhilippinesPolandPortugalPost-demographic dividendPre-demographic dividendQatarRomaniaRussian FederationRwandaSamoaSan MarinoSao Tome and PrincipeSaudi ArabiaSenegalSerbiaSeychellesSierra LeoneSlovak RepublicSloveniaSmall statesSolomon IslandsSouth AfricaSouth AsiaSouth Asia (IDA & IBRD)South SudanSpainSri LankaSt. Kitts and NevisSt. LuciaSt. Vincent and the GrenadinesSub-Saharan Africa Sub-Saharan Africa (excluding high income)Sub-Saharan Africa (IDA & IBRD countries)SudanSurinameSwazilandSwedenSwitzerlandSyrian Arab RepublicTajikistanTanzaniaThailandTimor-LesteTogoTongaTrinidad and TobagoTunisiaTurkeyTuvaluUgandaUkraineUnited Arab EmiratesUpper middle incomeUruguayUzbekistanVanuatuVenezuela, RBVietnamWest Bank and GazaWorldYemen, Rep.ZambiaZimbabwe Timeline:
This timeline shows a graph from 1972 to 2014 of Italy. No data until 1971. Number of actual observations by date: 41.
Source name:
World Development Indicators
Source organization:
United Nations Educational, Scientific, and Cultural Organization (UNESCO) Institute for Statistics.
Categories, topics:
Aid Effectiveness, Climate Change, Education
Last updated:
apr 23, 2017
Indicators value changes by year
Minimum:
95.733
jan 1, 1998
Maximum:
107.96
jan 1, 1976
At the date of observation
Value
Absolute change
Change from previous value
jan 1, 1972
97.253
+97.253
0.0%
jan 1, 1973
99.298
+2.046
2.1%
jan 1, 1974
99.104
-0.194
-0.2%
jan 1, 1975
100.295
+1.191
1.2%
jan 1, 1976
107.96
+7.665
7.64%
jan 1, 1977
106.093
-1.866
-1.73%
jan 1, 1978
105.523
-0.57
-0.54%
jan 1, 1979
102.565
-2.958
-2.8%
jan 1, 1980
102.068
-0.498
-0.49%
jan 1, 1981
103.574
+1.507
1.48%
jan 1, 1982
100.561
-3.013
-2.91%
jan 1, 1983
101.113
+0.552
0.55%
jan 1, 1984
100.219
-0.894
-0.88%
jan 1, 1985
100.23
+0.01
0.01%
jan 1, 1986
102.354
+2.124
2.12%
jan 1, 1987
101.887
-0.466
-0.46%
jan 1, 1988
100.54
-1.348
-1.32%
jan 1, 1989
99.973
-0.567
-0.56%
jan 1, 1990
100.32
+0.347
0.35%
jan 1, 1991
100.814
+0.495
0.49%
jan 1, 1992
98.094
-2.72
-2.7%
jan 1, 1993
98.578
+0.485
0.49%
jan 1, 1995
99.859
+1.281
1.3%
jan 1, 1996
98.502
-1.356
-1.36%
jan 1, 1997
99.141
+0.638
0.65%
jan 1, 1998
95.733
-3.408
-3.44%
jan 1, 2000
100.085
+4.352
4.55%
jan 1, 2001
100.814
+0.729
0.73%
jan 1, 2002
103.702
+2.888
2.86%
jan 1, 2003
102.045
-1.656
-1.6%
jan 1, 2004
102.354
+0.308
0.3%
jan 1, 2005
100.85
-1.503
-1.47%
jan 1, 2006
99.171
-1.679
-1.67%
jan 1, 2007
99.456
+0.285
0.29%
jan 1, 2008
101.48
+2.024
2.04%
jan 1, 2009
104.805
+3.325
3.28%
jan 1, 2010
102.605
-2.2
-2.1%
jan 1, 2011
103.107
+0.502
0.49%
jan 1, 2012
104.212
+1.105
1.07%
jan 1, 2013
100.661
-3.551
-3.41%
jan 1, 2014
100.05
-0.611
-0.61%
Ranking of countries by current statistics by years


Comments: