29
/
en
AIzaSyAYiBZKx7MnpbEhh9jyipgxe19OcubqV5w
April 1, 2024
112886
Costa Rica
CRI
true
2
1
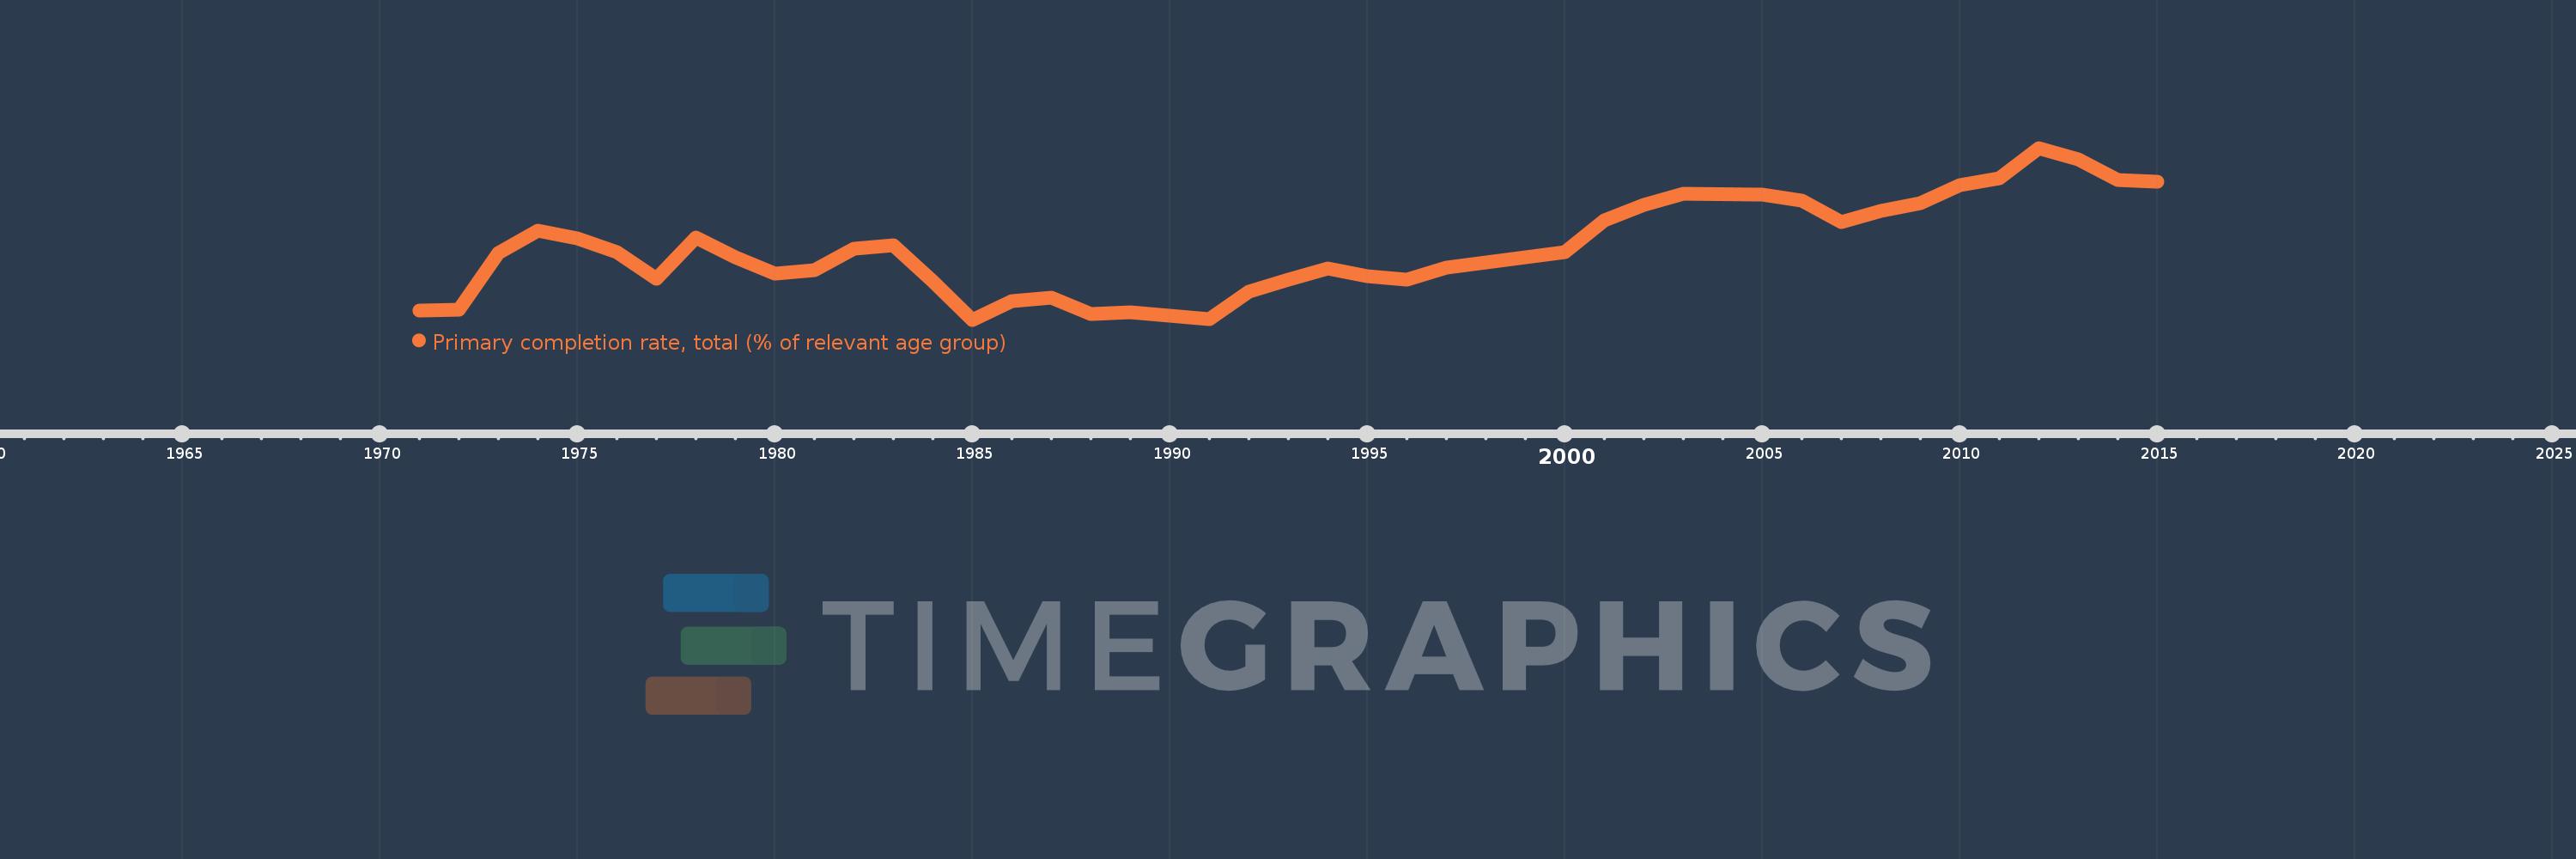
Primary completion rate, total (% of relevant age group)
2015,2014,2013,2012,2011,2010,2009,2008,2007,2006,2005,2003,2002,2001,2000,1997,1996,1995,1994,1993,1992,1991,1990,1989,1988,1987,1986,1985,1984,1983,1982,1981,1980,1979,1978,1977,1976,1975,1974,1973,1972,1971
This statistics in other country:
AfghanistanAlbaniaAlgeriaAngolaAntigua and BarbudaArab WorldArgentinaArmeniaArubaAustriaAzerbaijanBahamas, TheBahrainBangladeshBarbadosBelarusBelgiumBelizeBeninBermudaBhutanBoliviaBosnia and HerzegovinaBotswanaBrazilBritish Virgin IslandsBrunei DarussalamBulgariaBurkina FasoBurundiCabo VerdeCambodiaCameroonCanadaCaribbean small statesCentral African RepublicCentral Europe and the BalticsChadChileChinaColombiaComorosCongo, Dem. Rep.Congo, Rep.Costa RicaCote d'IvoireCroatiaCubaCyprusCzech RepublicDenmarkDjiboutiDominicaDominican RepublicEarly-demographic dividendEast Asia & PacificEast Asia & Pacific (excluding high income)East Asia & Pacific (IDA & IBRD countries)EcuadorEgypt, Arab Rep.El SalvadorEquatorial GuineaEritreaEstoniaEthiopiaEuro areaEurope & Central AsiaEurope & Central Asia (excluding high income)Europe & Central Asia (IDA & IBRD countries)European UnionFijiFinlandFragile and conflict affected situationsFranceGabonGambia, TheGeorgiaGermanyGhanaGreeceGrenadaGuatemalaGuineaGuinea-BissauGuyanaHaitiHeavily indebted poor countries (HIPC)High incomeHondurasHong Kong SAR, ChinaHungaryIBRD onlyIcelandIDA & IBRD totalIDA blendIDA onlyIDA totalIndiaIndonesiaIran, Islamic Rep.IraqIrelandIsraelItalyJamaicaJapanJordanKazakhstanKenyaKiribatiKorea, Dem. People’s Rep.Korea, Rep.KuwaitKyrgyz RepublicLao PDRLate-demographic dividendLatin America & Caribbean Latin America & Caribbean (excluding high income)Latin America & the Caribbean (IDA & IBRD countries)LatviaLeast developed countries: UN classificationLebanonLesothoLiberiaLibyaLiechtensteinLithuaniaLow & middle incomeLow incomeLower middle incomeLuxembourgMacao SAR, ChinaMacedonia, FYRMadagascarMalawiMalaysiaMaldivesMaliMaltaMarshall IslandsMauritaniaMauritiusMexicoMiddle East & North AfricaMiddle East & North Africa (excluding high income)Middle East & North Africa (IDA & IBRD countries)Middle incomeMoldovaMongoliaMontenegroMoroccoMozambiqueMyanmarNamibiaNauruNepalNetherlandsNew ZealandNicaraguaNigerNigeriaNorwayOECD membersOmanOther small statesPacific island small statesPakistanPalauPanamaPapua New GuineaParaguayPeruPhilippinesPolandPortugalPost-demographic dividendPre-demographic dividendQatarRomaniaRussian FederationRwandaSamoaSan MarinoSao Tome and PrincipeSaudi ArabiaSenegalSerbiaSeychellesSierra LeoneSlovak RepublicSloveniaSmall statesSolomon IslandsSouth AfricaSouth AsiaSouth Asia (IDA & IBRD)South SudanSpainSri LankaSt. Kitts and NevisSt. LuciaSt. Vincent and the GrenadinesSub-Saharan Africa Sub-Saharan Africa (excluding high income)Sub-Saharan Africa (IDA & IBRD countries)SudanSurinameSwazilandSwedenSwitzerlandSyrian Arab RepublicTajikistanTanzaniaThailandTimor-LesteTogoTongaTrinidad and TobagoTunisiaTurkeyTuvaluUgandaUkraineUnited Arab EmiratesUpper middle incomeUruguayUzbekistanVanuatuVenezuela, RBVietnamWest Bank and GazaWorldYemen, Rep.ZambiaZimbabwe Timeline:
This timeline shows a graph from 1971 to 2015 of Costa Rica. No data until 1970. Number of actual observations by date: 42.
Source name:
World Development Indicators
Source organization:
United Nations Educational, Scientific, and Cultural Organization (UNESCO) Institute for Statistics.
Categories, topics:
Aid Effectiveness, Climate Change, Education
Last updated:
apr 23, 2017
Indicators value changes by year
Minimum:
74.921
jan 1, 1985
Maximum:
104.537
jan 1, 2012
At the date of observation
Value
Absolute change
Change from previous value
jan 1, 1971
76.488
+76.488
0.0%
jan 1, 1972
76.726
+0.238
0.31%
jan 1, 1973
86.367
+9.641
12.57%
jan 1, 1974
90.317
+3.95
4.57%
jan 1, 1975
88.934
-1.383
-1.53%
jan 1, 1976
86.632
-2.301
-2.59%
jan 1, 1977
81.923
-4.709
-5.44%
jan 1, 1978
89.023
+7.1
8.67%
jan 1, 1979
85.622
-3.401
-3.82%
jan 1, 1980
82.869
-2.752
-3.21%
jan 1, 1981
83.459
+0.59
0.71%
jan 1, 1982
87.116
+3.657
4.38%
jan 1, 1983
87.772
+0.656
0.75%
jan 1, 1984
81.608
-6.164
-7.02%
jan 1, 1985
74.921
-6.687
-8.19%
jan 1, 1986
78.15
+3.228
4.31%
jan 1, 1987
78.684
+0.535
0.68%
jan 1, 1988
75.861
-2.823
-3.59%
jan 1, 1989
76.234
+0.373
0.49%
jan 1, 1990
75.643
-0.591
-0.78%
jan 1, 1991
75.059
-0.584
-0.77%
jan 1, 1992
79.763
+4.704
6.27%
jan 1, 1993
81.806
+2.042
2.56%
jan 1, 1994
83.726
+1.921
2.35%
jan 1, 1995
82.462
-1.265
-1.51%
jan 1, 1996
81.766
-0.696
-0.84%
jan 1, 1997
83.923
+2.157
2.64%
jan 1, 2000
86.561
+2.638
3.14%
jan 1, 2001
92.111
+5.55
6.41%
jan 1, 2002
94.775
+2.665
2.89%
jan 1, 2003
96.689
+1.913
2.02%
jan 1, 2005
96.461
-0.227
-0.23%
jan 1, 2006
95.439
-1.022
-1.06%
jan 1, 2007
91.7
-3.74
-3.92%
jan 1, 2008
93.73
+2.03
2.21%
jan 1, 2009
95.059
+1.329
1.42%
jan 1, 2010
98.132
+3.074
3.23%
jan 1, 2011
99.369
+1.237
1.26%
jan 1, 2012
104.537
+5.168
5.2%
jan 1, 2013
102.629
-1.908
-1.83%
jan 1, 2014
98.962
-3.666
-3.57%
jan 1, 2015
98.738
-0.224
-0.23%
Ranking of countries by current statistics by years


Comments: