29
/
en
AIzaSyAYiBZKx7MnpbEhh9jyipgxe19OcubqV5w
April 1, 2024
47642
Lower middle income
LMC
false
2
1
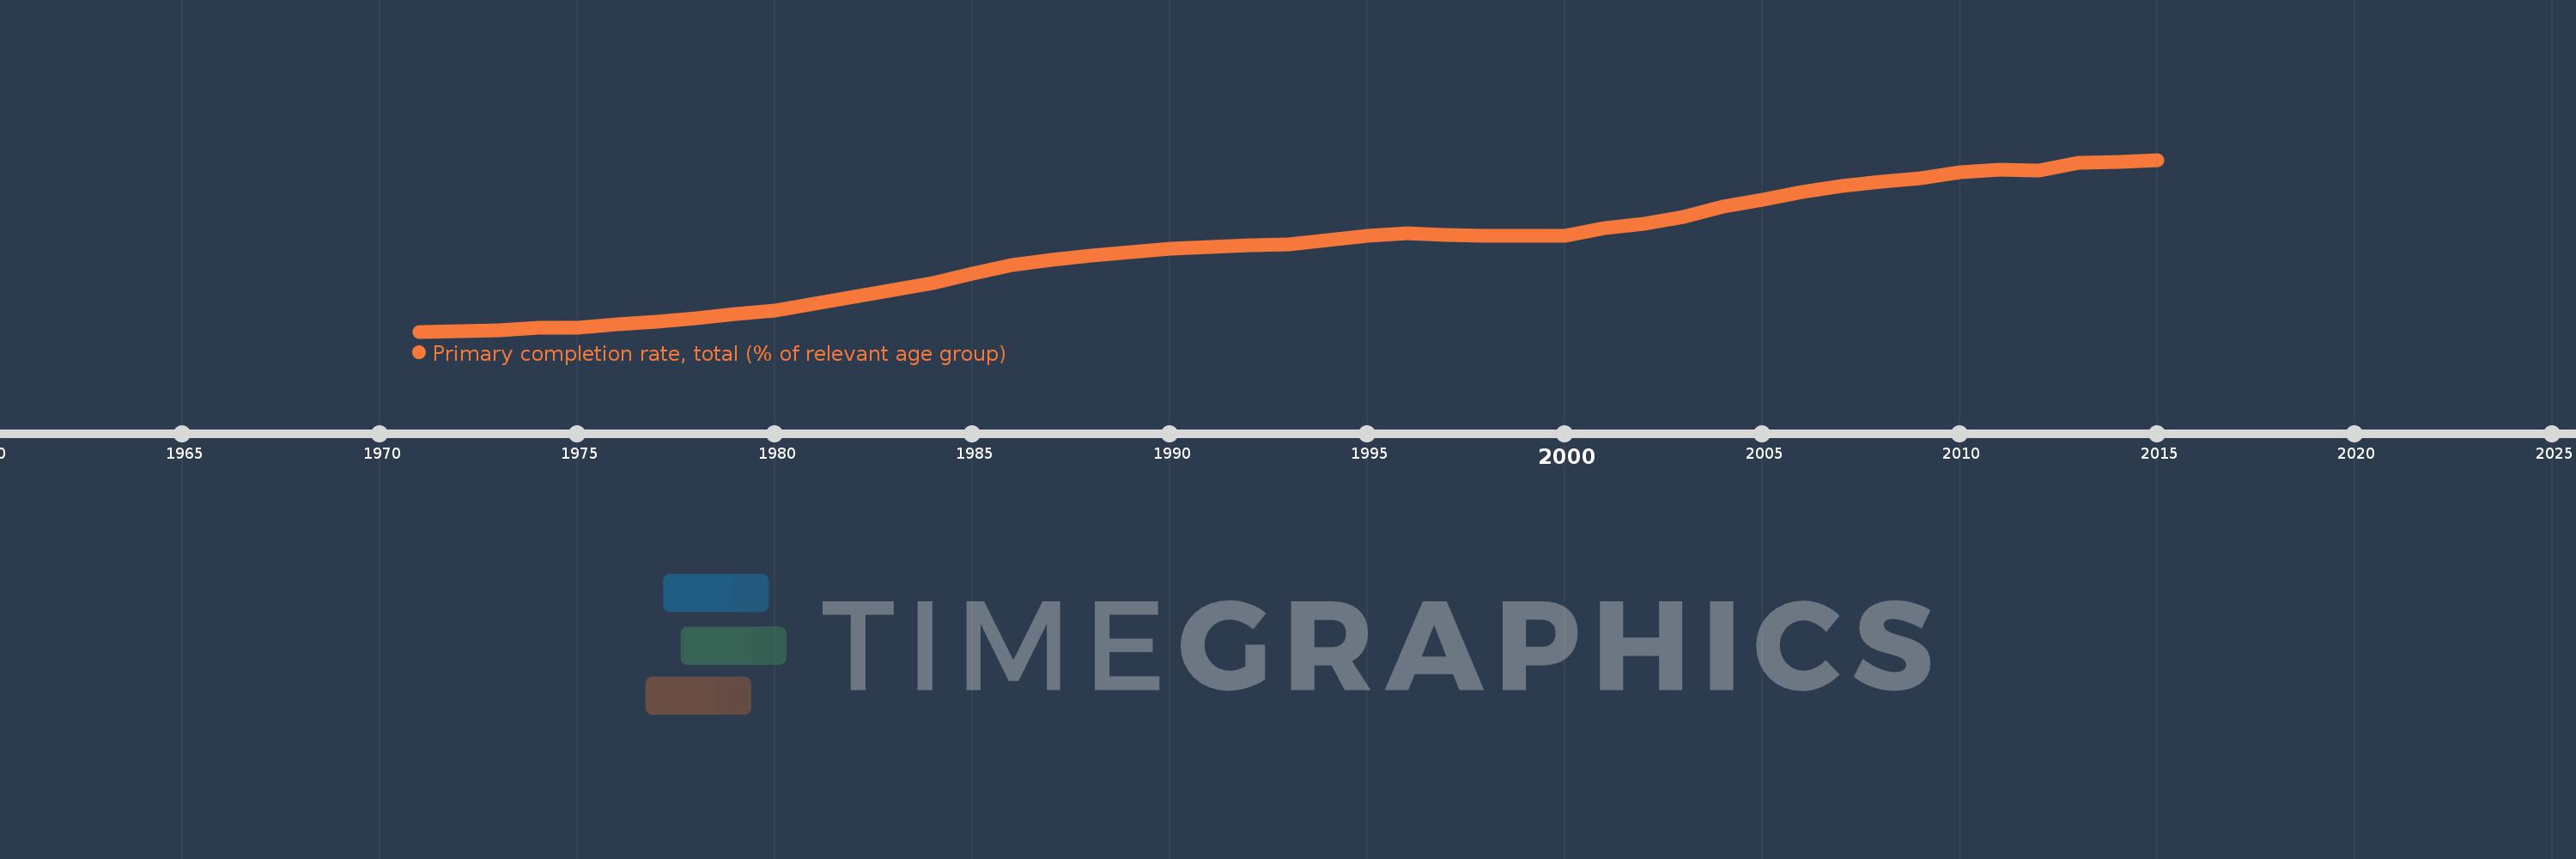
Primary completion rate, total (% of relevant age group)
2015,2014,2013,2012,2011,2010,2009,2008,2007,2006,2005,2004,2003,2002,2001,2000,1999,1998,1997,1996,1995,1994,1993,1992,1991,1990,1989,1988,1987,1986,1985,1984,1983,1982,1981,1980,1979,1978,1977,1976,1975,1974,1973,1972,1971
This statistics in other country:
AfghanistanAlbaniaAlgeriaAngolaAntigua and BarbudaArab WorldArgentinaArmeniaArubaAustriaAzerbaijanBahamas, TheBahrainBangladeshBarbadosBelarusBelgiumBelizeBeninBermudaBhutanBoliviaBosnia and HerzegovinaBotswanaBrazilBritish Virgin IslandsBrunei DarussalamBulgariaBurkina FasoBurundiCabo VerdeCambodiaCameroonCanadaCaribbean small statesCentral African RepublicCentral Europe and the BalticsChadChileChinaColombiaComorosCongo, Dem. Rep.Congo, Rep.Costa RicaCote d'IvoireCroatiaCubaCyprusCzech RepublicDenmarkDjiboutiDominicaDominican RepublicEarly-demographic dividendEast Asia & PacificEast Asia & Pacific (excluding high income)East Asia & Pacific (IDA & IBRD countries)EcuadorEgypt, Arab Rep.El SalvadorEquatorial GuineaEritreaEstoniaEthiopiaEuro areaEurope & Central AsiaEurope & Central Asia (excluding high income)Europe & Central Asia (IDA & IBRD countries)European UnionFijiFinlandFragile and conflict affected situationsFranceGabonGambia, TheGeorgiaGermanyGhanaGreeceGrenadaGuatemalaGuineaGuinea-BissauGuyanaHaitiHeavily indebted poor countries (HIPC)High incomeHondurasHong Kong SAR, ChinaHungaryIBRD onlyIcelandIDA & IBRD totalIDA blendIDA onlyIDA totalIndiaIndonesiaIran, Islamic Rep.IraqIrelandIsraelItalyJamaicaJapanJordanKazakhstanKenyaKiribatiKorea, Dem. People’s Rep.Korea, Rep.KuwaitKyrgyz RepublicLao PDRLate-demographic dividendLatin America & Caribbean Latin America & Caribbean (excluding high income)Latin America & the Caribbean (IDA & IBRD countries)LatviaLeast developed countries: UN classificationLebanonLesothoLiberiaLibyaLiechtensteinLithuaniaLow & middle incomeLow incomeLower middle incomeLuxembourgMacao SAR, ChinaMacedonia, FYRMadagascarMalawiMalaysiaMaldivesMaliMaltaMarshall IslandsMauritaniaMauritiusMexicoMiddle East & North AfricaMiddle East & North Africa (excluding high income)Middle East & North Africa (IDA & IBRD countries)Middle incomeMoldovaMongoliaMontenegroMoroccoMozambiqueMyanmarNamibiaNauruNepalNetherlandsNew ZealandNicaraguaNigerNigeriaNorwayOECD membersOmanOther small statesPacific island small statesPakistanPalauPanamaPapua New GuineaParaguayPeruPhilippinesPolandPortugalPost-demographic dividendPre-demographic dividendQatarRomaniaRussian FederationRwandaSamoaSan MarinoSao Tome and PrincipeSaudi ArabiaSenegalSerbiaSeychellesSierra LeoneSlovak RepublicSloveniaSmall statesSolomon IslandsSouth AfricaSouth AsiaSouth Asia (IDA & IBRD)South SudanSpainSri LankaSt. Kitts and NevisSt. LuciaSt. Vincent and the GrenadinesSub-Saharan Africa Sub-Saharan Africa (excluding high income)Sub-Saharan Africa (IDA & IBRD countries)SudanSurinameSwazilandSwedenSwitzerlandSyrian Arab RepublicTajikistanTanzaniaThailandTimor-LesteTogoTongaTrinidad and TobagoTunisiaTurkeyTuvaluUgandaUkraineUnited Arab EmiratesUpper middle incomeUruguayUzbekistanVanuatuVenezuela, RBVietnamWest Bank and GazaWorldYemen, Rep.ZambiaZimbabwe Timeline:
This timeline shows a graph from 1971 to 2015 of Lower middle income. No data until 1970. Number of actual observations by date: 45.
Source name:
World Development Indicators
Source organization:
United Nations Educational, Scientific, and Cultural Organization (UNESCO) Institute for Statistics.
Categories, topics:
Aid Effectiveness, Climate Change, Education
Last updated:
apr 23, 2017
Indicators value changes by year
Minimum:
51.897
jan 1, 1971
Maximum:
90.995
jan 1, 2015
At the date of observation
Value
Absolute change
Change from previous value
jan 1, 1971
51.897
+51.897
0.0%
jan 1, 1972
52.0
+0.103
0.2%
jan 1, 1973
52.126
+0.126
0.24%
jan 1, 1974
52.83
+0.704
1.35%
jan 1, 1975
52.833
+0.003
0.01%
jan 1, 1976
53.619
+0.786
1.49%
jan 1, 1977
54.165
+0.546
1.02%
jan 1, 1978
54.945
+0.78
1.44%
jan 1, 1979
55.94
+0.994
1.81%
jan 1, 1980
56.683
+0.743
1.33%
jan 1, 1981
58.201
+1.518
2.68%
jan 1, 1982
59.779
+1.578
2.71%
jan 1, 1983
61.461
+1.683
2.81%
jan 1, 1984
63.032
+1.571
2.56%
jan 1, 1985
65.084
+2.051
3.25%
jan 1, 1986
67.092
+2.009
3.09%
jan 1, 1987
68.317
+1.224
1.82%
jan 1, 1988
69.199
+0.882
1.29%
jan 1, 1989
69.995
+0.796
1.15%
jan 1, 1990
70.69
+0.695
0.99%
jan 1, 1991
71.242
+0.552
0.78%
jan 1, 1992
71.55
+0.308
0.43%
jan 1, 1993
71.818
+0.268
0.37%
jan 1, 1994
72.807
+0.989
1.38%
jan 1, 1995
73.622
+0.815
1.12%
jan 1, 1996
74.253
+0.632
0.86%
jan 1, 1997
73.889
-0.364
-0.49%
jan 1, 1998
73.65
-0.239
-0.32%
jan 1, 1999
73.655
+0.005
0.01%
jan 1, 2000
73.715
+0.06
0.08%
jan 1, 2001
75.435
+1.719
2.33%
jan 1, 2002
76.429
+0.994
1.32%
jan 1, 2003
78.031
+1.602
2.1%
jan 1, 2004
80.381
+2.35
3.01%
jan 1, 2005
81.913
+1.532
1.91%
jan 1, 2006
83.631
+1.718
2.1%
jan 1, 2007
85.026
+1.395
1.67%
jan 1, 2008
86.075
+1.049
1.23%
jan 1, 2009
86.767
+0.692
0.8%
jan 1, 2010
88.089
+1.322
1.52%
jan 1, 2011
88.793
+0.704
0.8%
jan 1, 2012
88.52
-0.273
-0.31%
jan 1, 2013
90.29
+1.77
2.0%
jan 1, 2014
90.592
+0.302
0.33%
jan 1, 2015
90.995
+0.403
0.45%
Ranking of countries by current statistics by years


Comments: