29
/
en
AIzaSyAYiBZKx7MnpbEhh9jyipgxe19OcubqV5w
April 1, 2024
117338
Cyprus
CYP
true
2
1
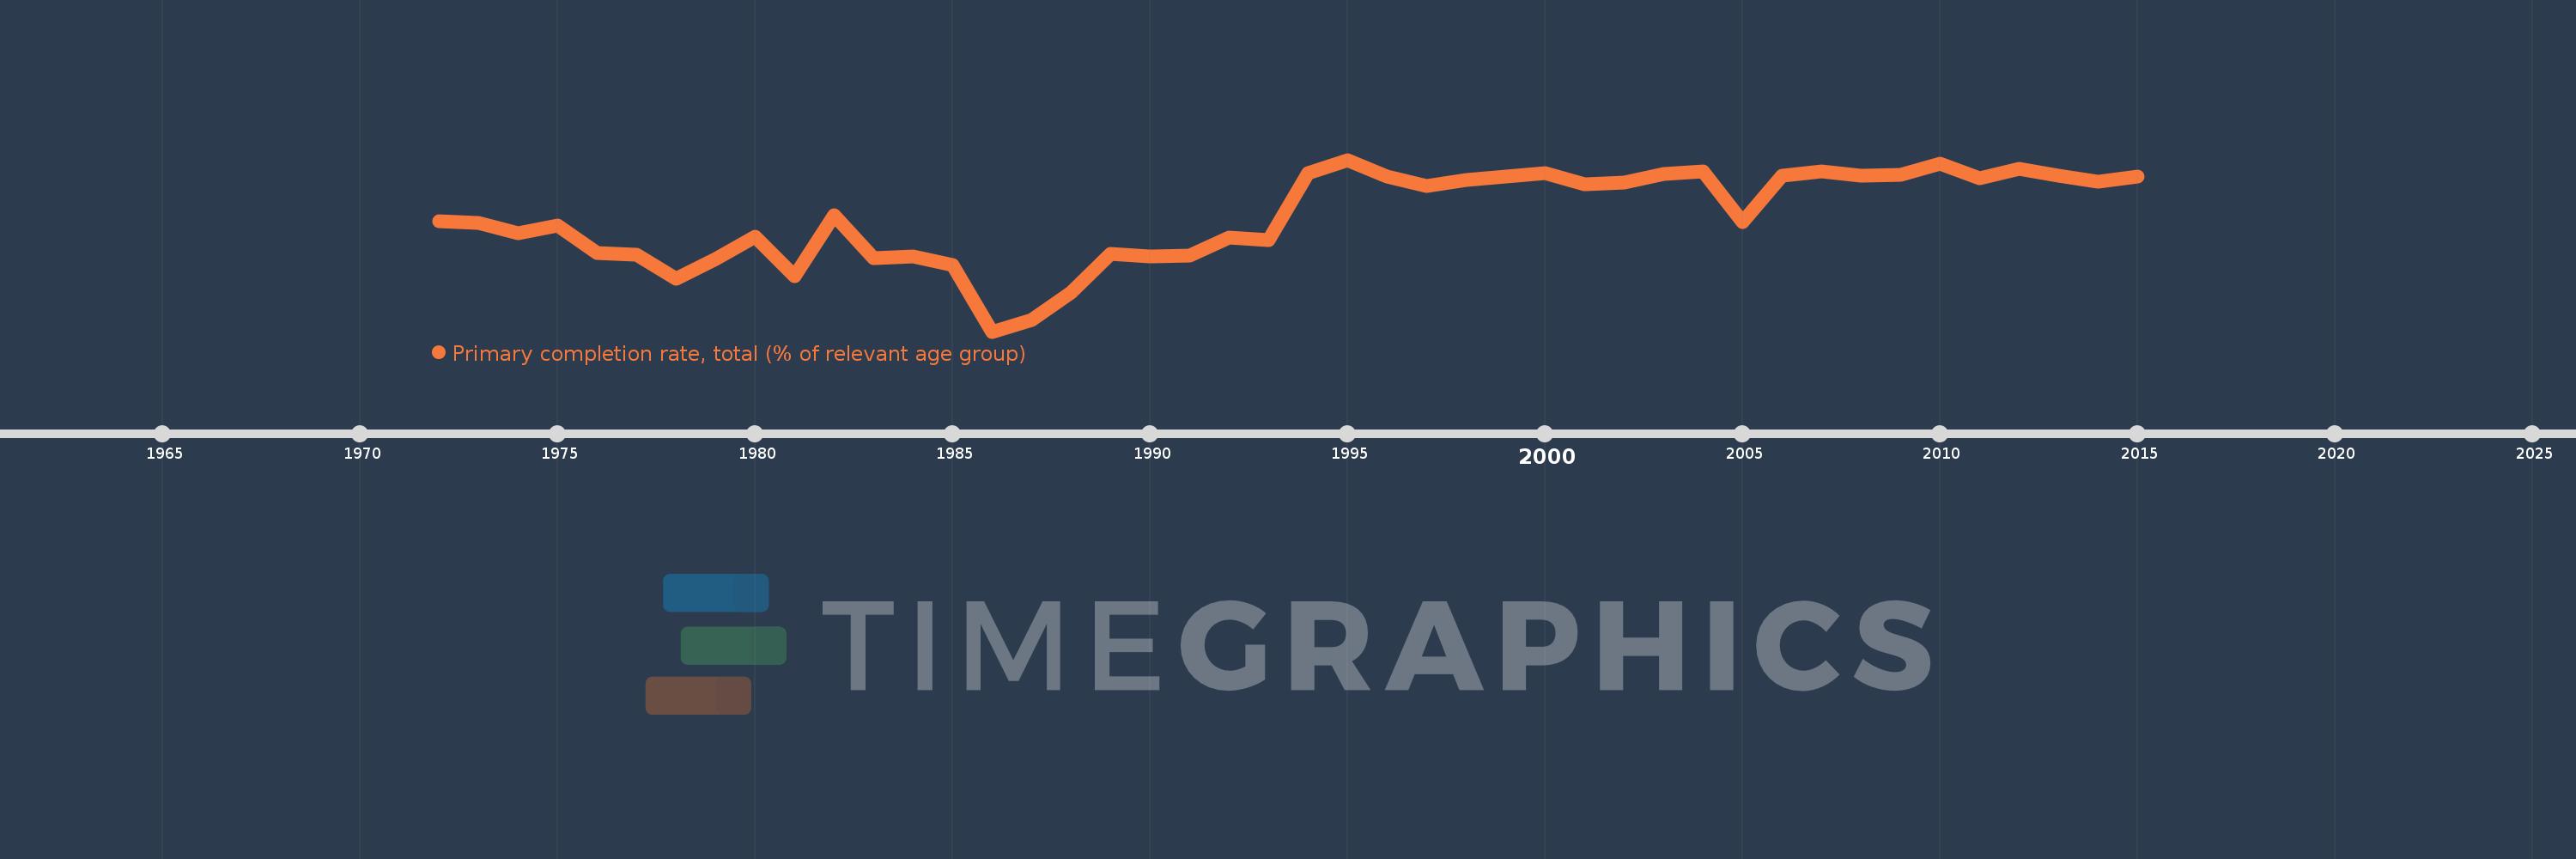
Primary completion rate, total (% of relevant age group)
2015,2014,2013,2012,2011,2010,2009,2008,2007,2006,2005,2004,2003,2002,2001,2000,1998,1997,1996,1995,1994,1993,1992,1991,1990,1989,1988,1987,1986,1985,1984,1983,1982,1981,1980,1979,1978,1977,1976,1975,1974,1973,1972
This statistics in other country:
AfghanistanAlbaniaAlgeriaAngolaAntigua and BarbudaArab WorldArgentinaArmeniaArubaAustriaAzerbaijanBahamas, TheBahrainBangladeshBarbadosBelarusBelgiumBelizeBeninBermudaBhutanBoliviaBosnia and HerzegovinaBotswanaBrazilBritish Virgin IslandsBrunei DarussalamBulgariaBurkina FasoBurundiCabo VerdeCambodiaCameroonCanadaCaribbean small statesCentral African RepublicCentral Europe and the BalticsChadChileChinaColombiaComorosCongo, Dem. Rep.Congo, Rep.Costa RicaCote d'IvoireCroatiaCubaCyprusCzech RepublicDenmarkDjiboutiDominicaDominican RepublicEarly-demographic dividendEast Asia & PacificEast Asia & Pacific (excluding high income)East Asia & Pacific (IDA & IBRD countries)EcuadorEgypt, Arab Rep.El SalvadorEquatorial GuineaEritreaEstoniaEthiopiaEuro areaEurope & Central AsiaEurope & Central Asia (excluding high income)Europe & Central Asia (IDA & IBRD countries)European UnionFijiFinlandFragile and conflict affected situationsFranceGabonGambia, TheGeorgiaGermanyGhanaGreeceGrenadaGuatemalaGuineaGuinea-BissauGuyanaHaitiHeavily indebted poor countries (HIPC)High incomeHondurasHong Kong SAR, ChinaHungaryIBRD onlyIcelandIDA & IBRD totalIDA blendIDA onlyIDA totalIndiaIndonesiaIran, Islamic Rep.IraqIrelandIsraelItalyJamaicaJapanJordanKazakhstanKenyaKiribatiKorea, Dem. People’s Rep.Korea, Rep.KuwaitKyrgyz RepublicLao PDRLate-demographic dividendLatin America & Caribbean Latin America & Caribbean (excluding high income)Latin America & the Caribbean (IDA & IBRD countries)LatviaLeast developed countries: UN classificationLebanonLesothoLiberiaLibyaLiechtensteinLithuaniaLow & middle incomeLow incomeLower middle incomeLuxembourgMacao SAR, ChinaMacedonia, FYRMadagascarMalawiMalaysiaMaldivesMaliMaltaMarshall IslandsMauritaniaMauritiusMexicoMiddle East & North AfricaMiddle East & North Africa (excluding high income)Middle East & North Africa (IDA & IBRD countries)Middle incomeMoldovaMongoliaMontenegroMoroccoMozambiqueMyanmarNamibiaNauruNepalNetherlandsNew ZealandNicaraguaNigerNigeriaNorwayOECD membersOmanOther small statesPacific island small statesPakistanPalauPanamaPapua New GuineaParaguayPeruPhilippinesPolandPortugalPost-demographic dividendPre-demographic dividendQatarRomaniaRussian FederationRwandaSamoaSan MarinoSao Tome and PrincipeSaudi ArabiaSenegalSerbiaSeychellesSierra LeoneSlovak RepublicSloveniaSmall statesSolomon IslandsSouth AfricaSouth AsiaSouth Asia (IDA & IBRD)South SudanSpainSri LankaSt. Kitts and NevisSt. LuciaSt. Vincent and the GrenadinesSub-Saharan Africa Sub-Saharan Africa (excluding high income)Sub-Saharan Africa (IDA & IBRD countries)SudanSurinameSwazilandSwedenSwitzerlandSyrian Arab RepublicTajikistanTanzaniaThailandTimor-LesteTogoTongaTrinidad and TobagoTunisiaTurkeyTuvaluUgandaUkraineUnited Arab EmiratesUpper middle incomeUruguayUzbekistanVanuatuVenezuela, RBVietnamWest Bank and GazaWorldYemen, Rep.ZambiaZimbabwe Timeline:
This timeline shows a graph from 1972 to 2015 of Cyprus. No data until 1971. Number of actual observations by date: 43.
Source name:
World Development Indicators
Source organization:
United Nations Educational, Scientific, and Cultural Organization (UNESCO) Institute for Statistics.
Categories, topics:
Aid Effectiveness, Climate Change, Education
Last updated:
apr 23, 2017
Indicators value changes by year
Minimum:
58.125
jan 1, 1986
Maximum:
104.239
jan 1, 1995
At the date of observation
Value
Absolute change
Change from previous value
jan 1, 1972
87.749
+87.749
0.0%
jan 1, 1973
87.378
-0.371
-0.42%
jan 1, 1974
84.588
-2.79
-3.19%
jan 1, 1975
86.598
+2.01
2.38%
jan 1, 1976
79.122
-7.476
-8.63%
jan 1, 1977
78.651
-0.472
-0.6%
jan 1, 1978
72.239
-6.411
-8.15%
jan 1, 1979
77.637
+5.398
7.47%
jan 1, 1980
83.596
+5.959
7.68%
jan 1, 1981
73.073
-10.523
-12.59%
jan 1, 1982
89.333
+16.261
22.25%
jan 1, 1983
77.816
-11.518
-12.89%
jan 1, 1984
78.405
+0.59
0.76%
jan 1, 1985
76.004
-2.401
-3.06%
jan 1, 1986
58.125
-17.879
-23.52%
jan 1, 1987
61.31
+3.186
5.48%
jan 1, 1988
68.538
+7.227
11.79%
jan 1, 1989
78.935
+10.397
15.17%
jan 1, 1990
78.21
-0.725
-0.92%
jan 1, 1991
78.6
+0.39
0.5%
jan 1, 1992
83.332
+4.732
6.02%
jan 1, 1993
82.679
-0.652
-0.78%
jan 1, 1994
100.767
+18.088
21.88%
jan 1, 1995
104.239
+3.472
3.45%
jan 1, 1996
99.691
-4.548
-4.36%
jan 1, 1997
97.158
-2.533
-2.54%
jan 1, 1998
98.862
+1.704
1.75%
jan 1, 2000
100.719
+1.857
1.88%
jan 1, 2001
97.66
-3.059
-3.04%
jan 1, 2002
98.042
+0.383
0.39%
jan 1, 2003
100.45
+2.408
2.46%
jan 1, 2004
101.185
+0.735
0.73%
jan 1, 2005
87.552
-13.633
-13.47%
jan 1, 2006
100.082
+12.53
14.31%
jan 1, 2007
101.146
+1.064
1.06%
jan 1, 2008
99.952
-1.195
-1.18%
jan 1, 2009
100.246
+0.295
0.29%
jan 1, 2010
103.16
+2.914
2.91%
jan 1, 2011
99.316
-3.844
-3.73%
jan 1, 2012
101.733
+2.417
2.43%
jan 1, 2013
100.064
-1.669
-1.64%
jan 1, 2014
98.332
-1.732
-1.73%
jan 1, 2015
99.825
+1.493
1.52%
Ranking of countries by current statistics by years


Comments: