29
/
en
AIzaSyAYiBZKx7MnpbEhh9jyipgxe19OcubqV5w
April 1, 2024
48492
Middle East & North Africa
MEA
false
2
1
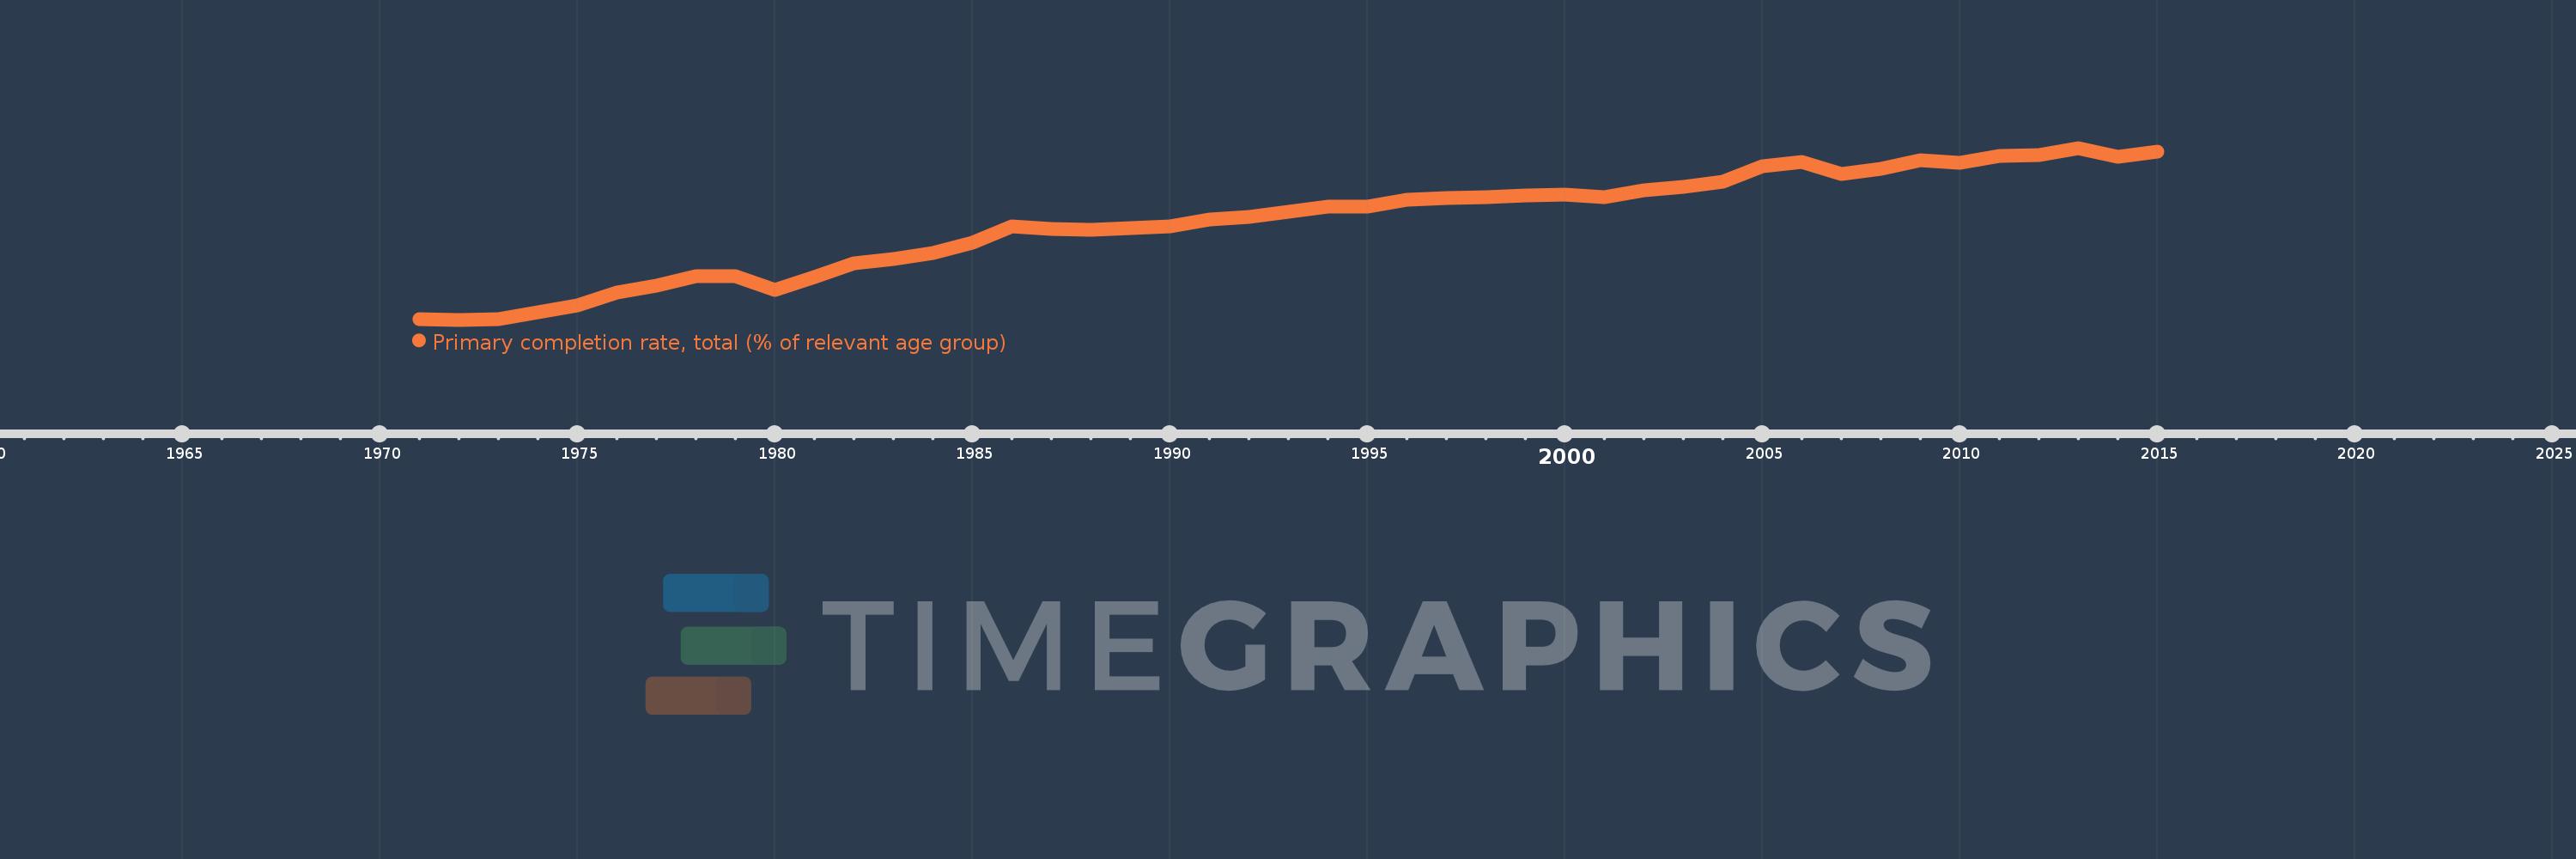
Primary completion rate, total (% of relevant age group)
2015,2014,2013,2012,2011,2010,2009,2008,2007,2006,2005,2004,2003,2002,2001,2000,1999,1998,1997,1996,1995,1994,1993,1992,1991,1990,1989,1988,1987,1986,1985,1984,1983,1982,1981,1980,1979,1978,1977,1976,1975,1974,1973,1972,1971
This statistics in other country:
AfghanistanAlbaniaAlgeriaAngolaAntigua and BarbudaArab WorldArgentinaArmeniaArubaAustriaAzerbaijanBahamas, TheBahrainBangladeshBarbadosBelarusBelgiumBelizeBeninBermudaBhutanBoliviaBosnia and HerzegovinaBotswanaBrazilBritish Virgin IslandsBrunei DarussalamBulgariaBurkina FasoBurundiCabo VerdeCambodiaCameroonCanadaCaribbean small statesCentral African RepublicCentral Europe and the BalticsChadChileChinaColombiaComorosCongo, Dem. Rep.Congo, Rep.Costa RicaCote d'IvoireCroatiaCubaCyprusCzech RepublicDenmarkDjiboutiDominicaDominican RepublicEarly-demographic dividendEast Asia & PacificEast Asia & Pacific (excluding high income)East Asia & Pacific (IDA & IBRD countries)EcuadorEgypt, Arab Rep.El SalvadorEquatorial GuineaEritreaEstoniaEthiopiaEuro areaEurope & Central AsiaEurope & Central Asia (excluding high income)Europe & Central Asia (IDA & IBRD countries)European UnionFijiFinlandFragile and conflict affected situationsFranceGabonGambia, TheGeorgiaGermanyGhanaGreeceGrenadaGuatemalaGuineaGuinea-BissauGuyanaHaitiHeavily indebted poor countries (HIPC)High incomeHondurasHong Kong SAR, ChinaHungaryIBRD onlyIcelandIDA & IBRD totalIDA blendIDA onlyIDA totalIndiaIndonesiaIran, Islamic Rep.IraqIrelandIsraelItalyJamaicaJapanJordanKazakhstanKenyaKiribatiKorea, Dem. People’s Rep.Korea, Rep.KuwaitKyrgyz RepublicLao PDRLate-demographic dividendLatin America & Caribbean Latin America & Caribbean (excluding high income)Latin America & the Caribbean (IDA & IBRD countries)LatviaLeast developed countries: UN classificationLebanonLesothoLiberiaLibyaLiechtensteinLithuaniaLow & middle incomeLow incomeLower middle incomeLuxembourgMacao SAR, ChinaMacedonia, FYRMadagascarMalawiMalaysiaMaldivesMaliMaltaMarshall IslandsMauritaniaMauritiusMexicoMiddle East & North AfricaMiddle East & North Africa (excluding high income)Middle East & North Africa (IDA & IBRD countries)Middle incomeMoldovaMongoliaMontenegroMoroccoMozambiqueMyanmarNamibiaNauruNepalNetherlandsNew ZealandNicaraguaNigerNigeriaNorwayOECD membersOmanOther small statesPacific island small statesPakistanPalauPanamaPapua New GuineaParaguayPeruPhilippinesPolandPortugalPost-demographic dividendPre-demographic dividendQatarRomaniaRussian FederationRwandaSamoaSan MarinoSao Tome and PrincipeSaudi ArabiaSenegalSerbiaSeychellesSierra LeoneSlovak RepublicSloveniaSmall statesSolomon IslandsSouth AfricaSouth AsiaSouth Asia (IDA & IBRD)South SudanSpainSri LankaSt. Kitts and NevisSt. LuciaSt. Vincent and the GrenadinesSub-Saharan Africa Sub-Saharan Africa (excluding high income)Sub-Saharan Africa (IDA & IBRD countries)SudanSurinameSwazilandSwedenSwitzerlandSyrian Arab RepublicTajikistanTanzaniaThailandTimor-LesteTogoTongaTrinidad and TobagoTunisiaTurkeyTuvaluUgandaUkraineUnited Arab EmiratesUpper middle incomeUruguayUzbekistanVanuatuVenezuela, RBVietnamWest Bank and GazaWorldYemen, Rep.ZambiaZimbabwe Timeline:
This timeline shows a graph from 1971 to 2015 of Middle East & North Africa. No data until 1970. Number of actual observations by date: 45.
Source name:
World Development Indicators
Source organization:
United Nations Educational, Scientific, and Cultural Organization (UNESCO) Institute for Statistics.
Categories, topics:
Aid Effectiveness, Climate Change, Education
Last updated:
apr 23, 2017
Indicators value changes by year
Minimum:
49.319
jan 1, 1972
Maximum:
94.675
jan 1, 2013
At the date of observation
Value
Absolute change
Change from previous value
jan 1, 1971
49.383
+49.383
0.0%
jan 1, 1972
49.319
-0.064
-0.13%
jan 1, 1973
49.389
+0.069
0.14%
jan 1, 1974
51.287
+1.898
3.84%
jan 1, 1975
53.152
+1.866
3.64%
jan 1, 1976
56.405
+3.252
6.12%
jan 1, 1977
58.372
+1.967
3.49%
jan 1, 1978
60.9
+2.529
4.33%
jan 1, 1979
60.729
-0.171
-0.28%
jan 1, 1980
57.132
-3.597
-5.92%
jan 1, 1981
60.551
+3.419
5.98%
jan 1, 1982
64.245
+3.694
6.1%
jan 1, 1983
65.371
+1.125
1.75%
jan 1, 1984
66.934
+1.564
2.39%
jan 1, 1985
69.587
+2.653
3.96%
jan 1, 1986
74.004
+4.417
6.35%
jan 1, 1987
73.177
-0.827
-1.12%
jan 1, 1988
73.034
-0.143
-0.2%
jan 1, 1989
73.47
+0.436
0.6%
jan 1, 1990
73.867
+0.397
0.54%
jan 1, 1991
75.676
+1.809
2.45%
jan 1, 1992
76.428
+0.752
0.99%
jan 1, 1993
77.805
+1.378
1.8%
jan 1, 1994
79.162
+1.357
1.74%
jan 1, 1995
79.259
+0.097
0.12%
jan 1, 1996
80.888
+1.628
2.05%
jan 1, 1997
81.345
+0.457
0.56%
jan 1, 1998
81.665
+0.32
0.39%
jan 1, 1999
82.078
+0.413
0.51%
jan 1, 2000
82.454
+0.376
0.46%
jan 1, 2001
81.703
-0.751
-0.91%
jan 1, 2002
83.544
+1.841
2.25%
jan 1, 2003
84.346
+0.801
0.96%
jan 1, 2004
85.87
+1.524
1.81%
jan 1, 2005
89.742
+3.873
4.51%
jan 1, 2006
90.962
+1.22
1.36%
jan 1, 2007
87.868
-3.094
-3.4%
jan 1, 2008
89.097
+1.229
1.4%
jan 1, 2009
91.487
+2.39
2.68%
jan 1, 2010
90.65
-0.836
-0.91%
jan 1, 2011
92.627
+1.977
2.18%
jan 1, 2012
92.744
+0.117
0.13%
jan 1, 2013
94.675
+1.932
2.08%
jan 1, 2014
92.396
-2.28
-2.41%
jan 1, 2015
93.735
+1.339
1.45%
Ranking of countries by current statistics by years


Comments: