29
/
en
AIzaSyAYiBZKx7MnpbEhh9jyipgxe19OcubqV5w
April 1, 2024
214716
Norway
NOR
true
2
1
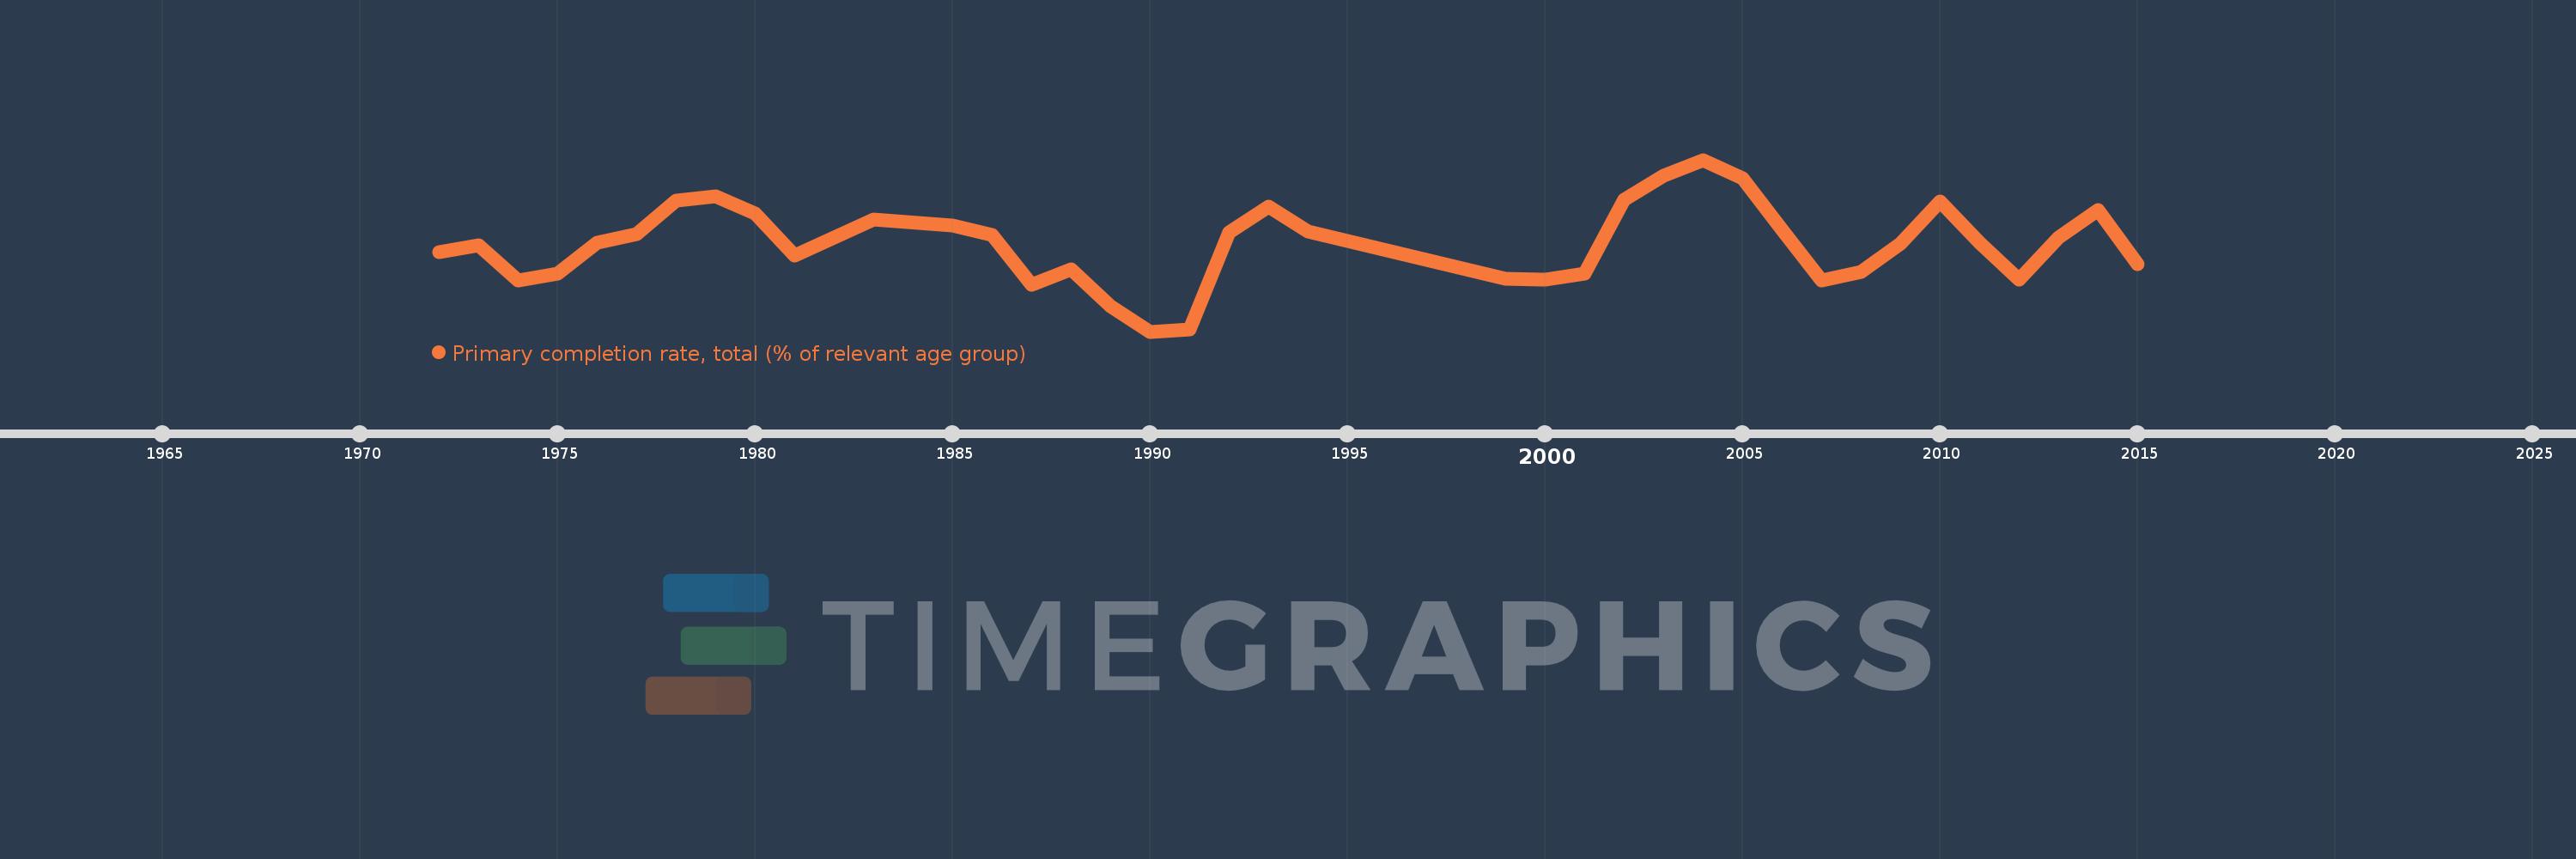
Primary completion rate, total (% of relevant age group)
2015,2014,2013,2012,2011,2010,2009,2008,2007,2006,2005,2004,2003,2002,2001,2000,1999,1994,1993,1992,1991,1990,1989,1988,1987,1986,1985,1983,1982,1981,1980,1979,1978,1977,1976,1975,1974,1973,1972
This statistics in other country:
AfghanistanAlbaniaAlgeriaAngolaAntigua and BarbudaArab WorldArgentinaArmeniaArubaAustriaAzerbaijanBahamas, TheBahrainBangladeshBarbadosBelarusBelgiumBelizeBeninBermudaBhutanBoliviaBosnia and HerzegovinaBotswanaBrazilBritish Virgin IslandsBrunei DarussalamBulgariaBurkina FasoBurundiCabo VerdeCambodiaCameroonCanadaCaribbean small statesCentral African RepublicCentral Europe and the BalticsChadChileChinaColombiaComorosCongo, Dem. Rep.Congo, Rep.Costa RicaCote d'IvoireCroatiaCubaCyprusCzech RepublicDenmarkDjiboutiDominicaDominican RepublicEarly-demographic dividendEast Asia & PacificEast Asia & Pacific (excluding high income)East Asia & Pacific (IDA & IBRD countries)EcuadorEgypt, Arab Rep.El SalvadorEquatorial GuineaEritreaEstoniaEthiopiaEuro areaEurope & Central AsiaEurope & Central Asia (excluding high income)Europe & Central Asia (IDA & IBRD countries)European UnionFijiFinlandFragile and conflict affected situationsFranceGabonGambia, TheGeorgiaGermanyGhanaGreeceGrenadaGuatemalaGuineaGuinea-BissauGuyanaHaitiHeavily indebted poor countries (HIPC)High incomeHondurasHong Kong SAR, ChinaHungaryIBRD onlyIcelandIDA & IBRD totalIDA blendIDA onlyIDA totalIndiaIndonesiaIran, Islamic Rep.IraqIrelandIsraelItalyJamaicaJapanJordanKazakhstanKenyaKiribatiKorea, Dem. People’s Rep.Korea, Rep.KuwaitKyrgyz RepublicLao PDRLate-demographic dividendLatin America & Caribbean Latin America & Caribbean (excluding high income)Latin America & the Caribbean (IDA & IBRD countries)LatviaLeast developed countries: UN classificationLebanonLesothoLiberiaLibyaLiechtensteinLithuaniaLow & middle incomeLow incomeLower middle incomeLuxembourgMacao SAR, ChinaMacedonia, FYRMadagascarMalawiMalaysiaMaldivesMaliMaltaMarshall IslandsMauritaniaMauritiusMexicoMiddle East & North AfricaMiddle East & North Africa (excluding high income)Middle East & North Africa (IDA & IBRD countries)Middle incomeMoldovaMongoliaMontenegroMoroccoMozambiqueMyanmarNamibiaNauruNepalNetherlandsNew ZealandNicaraguaNigerNigeriaNorwayOECD membersOmanOther small statesPacific island small statesPakistanPalauPanamaPapua New GuineaParaguayPeruPhilippinesPolandPortugalPost-demographic dividendPre-demographic dividendQatarRomaniaRussian FederationRwandaSamoaSan MarinoSao Tome and PrincipeSaudi ArabiaSenegalSerbiaSeychellesSierra LeoneSlovak RepublicSloveniaSmall statesSolomon IslandsSouth AfricaSouth AsiaSouth Asia (IDA & IBRD)South SudanSpainSri LankaSt. Kitts and NevisSt. LuciaSt. Vincent and the GrenadinesSub-Saharan Africa Sub-Saharan Africa (excluding high income)Sub-Saharan Africa (IDA & IBRD countries)SudanSurinameSwazilandSwedenSwitzerlandSyrian Arab RepublicTajikistanTanzaniaThailandTimor-LesteTogoTongaTrinidad and TobagoTunisiaTurkeyTuvaluUgandaUkraineUnited Arab EmiratesUpper middle incomeUruguayUzbekistanVanuatuVenezuela, RBVietnamWest Bank and GazaWorldYemen, Rep.ZambiaZimbabwe Timeline:
This timeline shows a graph from 1972 to 2015 of Norway. No data until 1971. Number of actual observations by date: 39.
Source name:
World Development Indicators
Source organization:
United Nations Educational, Scientific, and Cultural Organization (UNESCO) Institute for Statistics.
Categories, topics:
Aid Effectiveness, Climate Change, Education
Last updated:
apr 23, 2017
Indicators value changes by year
Minimum:
95.108
jan 1, 1990
At the date of observation
Value
Absolute change
Change from previous value
jan 1, 1972
99.044
+99.044
0.0%
jan 1, 1973
99.388
+0.344
0.35%
jan 1, 1974
97.622
-1.766
-1.78%
jan 1, 1975
97.987
+0.365
0.37%
jan 1, 1976
99.508
+1.521
1.55%
jan 1, 1977
99.924
+0.416
0.42%
jan 1, 1978
101.584
+1.66
1.66%
jan 1, 1979
101.778
+0.194
0.19%
jan 1, 1980
100.926
-0.852
-0.84%
jan 1, 1981
98.867
-2.059
-2.04%
jan 1, 1982
99.737
+0.87
0.88%
jan 1, 1983
100.666
+0.929
0.93%
jan 1, 1985
100.364
-0.302
-0.3%
jan 1, 1986
99.873
-0.491
-0.49%
jan 1, 1987
97.417
-2.455
-2.46%
jan 1, 1988
98.185
+0.768
0.79%
jan 1, 1989
96.369
-1.816
-1.85%
jan 1, 1990
95.108
-1.261
-1.31%
jan 1, 1991
95.224
+0.115
0.12%
jan 1, 1992
100.002
+4.778
5.02%
jan 1, 1993
101.277
+1.276
1.28%
jan 1, 1994
100.041
-1.237
-1.22%
jan 1, 1999
97.712
-2.329
-2.33%
jan 1, 2000
97.674
-0.038
-0.04%
jan 1, 2001
97.989
+0.315
0.32%
jan 1, 2002
101.635
+3.647
3.72%
jan 1, 2003
102.805
+1.169
1.15%
jan 1, 2004
103.6
+0.795
0.77%
jan 1, 2005
102.707
-0.893
-0.86%
jan 1, 2006
100.151
-2.556
-2.49%
jan 1, 2007
97.643
-2.508
-2.5%
jan 1, 2008
98.065
+0.422
0.43%
jan 1, 2009
99.471
+1.406
1.43%
jan 1, 2010
101.544
+2.073
2.08%
jan 1, 2011
99.504
-2.04
-2.01%
jan 1, 2012
97.657
-1.848
-1.86%
jan 1, 2013
99.747
+2.09
2.14%
jan 1, 2014
101.134
+1.388
1.39%
jan 1, 2015
98.456
-2.678
-2.65%
Ranking of countries by current statistics by years


Comments: